
FIGURE 4.
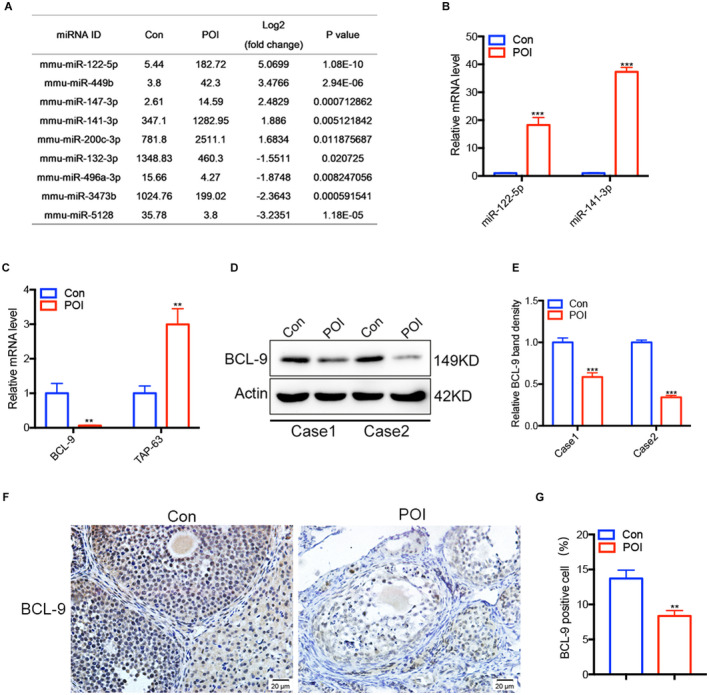
Differentially expressed miRNAs in ovarian exosomes and their target genes in ovarian tissues. (A) The levels of miRNAs in ovarian exosomes in the control group and the POI group. (B) The miR‐122‐5p and miR‐141‐3p expression in each group were detected by quantitative real‐time polymerase chain reaction (qRT‐PCR). (C) The BCL9 and TAP‐63 expression in each group were determined by qRT‐PCR. BCL9 in ovarian tissue between the two groups was determined by western blot (D) and gray scale analysis (E). Immunohistochemistry (F) and Image J analyses (G) were used to verify the difference of BCL9 in ovarian tissue between the two groups. *p < 0.05, **p < 0.01, ***p < 0.001