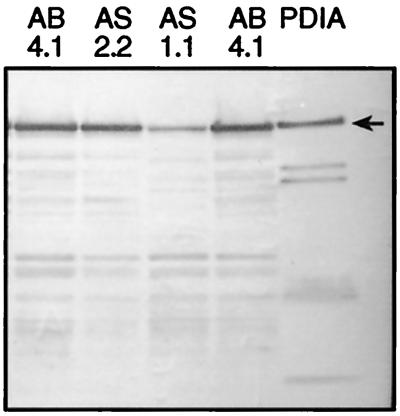
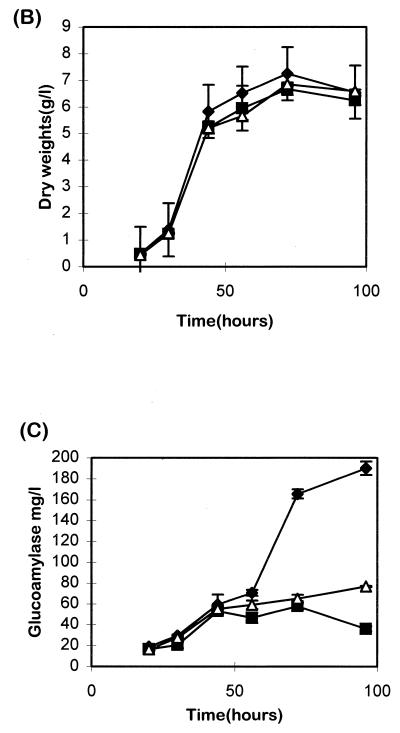
FIG. 6.
(A [top panel]) Western blot of microsomal extracts from A. niger AB4.1, AS1.1, and AS2.2 probed with antiserum to PDIA. The arrow indicates the predicted size of PDIA. (B) Dry weights of A. niger AB4.1 (⧫), AS1.1 (■), and AS2.2 (▵) in ACMS/N/P-grown cultures. Values represent the average ± the SEM (bars) from triplicate experiments. (C) Amount of glucoamylase secreted by A. niger AB4.1, AS1.1, and AS2.2 in ACMS/N/P-grown cultures. Values represent the average ± the SEM (bars) of triplicate experiments.


