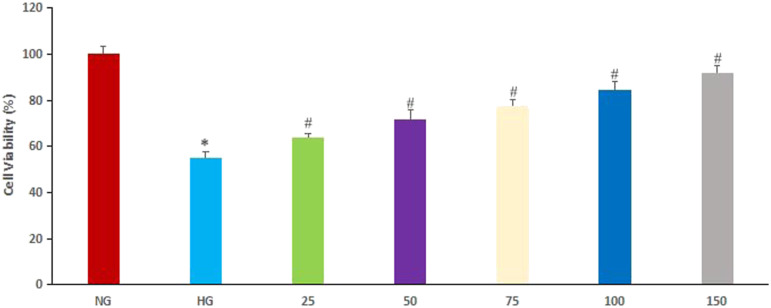
Figure 1.
Effect of epigallocatechin-3-gallate (EGCG) on cell viability. Normal glucose (NG), cells treated with 5.5 mmol/L glucose; High glucose (HG), cells treated with 30 mmol/L glucose, 25: 25 μg/mL EGCG, 50: 50 μg/mL EGCG, 75: 75 μg/mL EGCG, 100: 100 μg/mL EGCG, 150: 150 μg/mL EGCG. (*P < .05, #P < .01 vs NG group).

