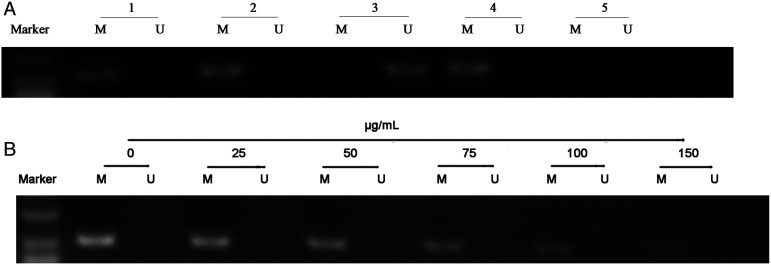
Figure 2.
Methylation status of actinin alpha 4 (ACTN4) in HPC cells and ACTN4 gene demethylation induced by EGCG. M: Methylation-specific PCR. U: Unmethylation-specific PCR. (A): Methylation status of ACTN4 in HPC cells. Line 1: Methylation status of ACTN4 in HPC without HG treatment. Line 2: Methylation status of ACTN4 in the diabetic nephropathy (DN) cell model. Line 3: Unmethylated positive control. Line 4: Methylated positive control. Line 5: Negative Control. (B): ACTN4 demethylation induced by EGCG.

