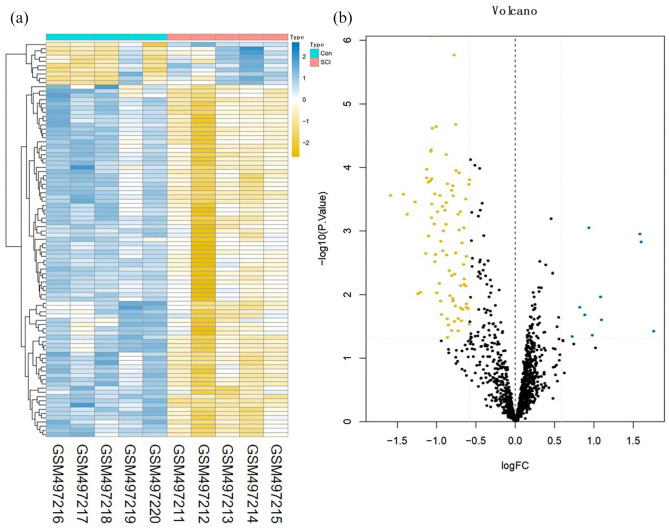
Figure 7.
Difference analysis of the GSE19890 dataset. (a) miRNA heat map of the GSE19890 dataset and (b) volcano plot of the GSE19890 dataset. The blue and yellow dots represent statistically significant high and low RNA expression levels based on a comparison of the SCI and control groups, respectively. The black dots represent differences without statistical significance. (A color version of this figure is available in the online journal.)

