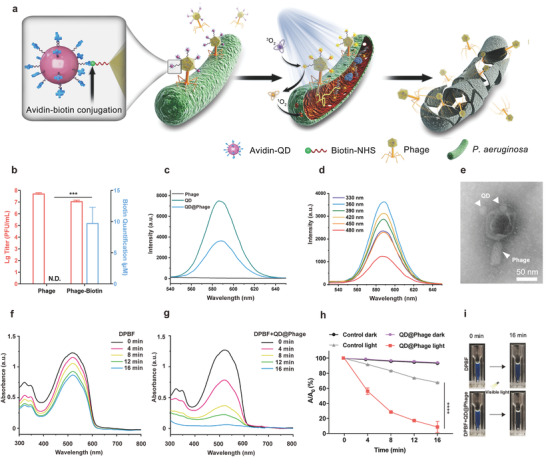
Figure 1.

Synthesis and photocatalytic performance of QD@Phage. a) Schematic illustration of phage‐assisted photocatalytic therapy against GFP‐P. aeruginosa. b) Phage titer and biotin quantification after optimal dropping dose of Biotin‐NHS. N.D. represents no detection. The data are presented as mean ± standard deviation (SD), n = 3. c) Fluorescence spectra of phage, QD, and QD@Phage at excitation wavelength 360 nm. d) Fluorescence spectra of QD@Phage with the excitation wavelength from 330 to 480 nm. e) A representative transmission electron microscope (TEM) image of the QD@Phage. Scale bar: 50 nm. UV–vis absorption spectra of f) 1,3‐diphenylisobenzofuran (DPBF) and g) DPBF + QD@Phage with visible light irradiation, respectively. h) Time‐dependent bleaching of DPBF by QD@Phage with or without exposure to visible light. A 0 is the initial absorbance of DPBF, and A indicates the residual absorbance in solution at time t. The PBS treatment served as control group. i) Photographs of DPBF, in the absence and presence of QD@Phage, under 16 min of visible light irradiation. The data are presented as mean ± SD, n = 3. ***p < 0.001 and ****p < 0.0001 by t‐test for data in (b) and (h).
