
Figure 2.
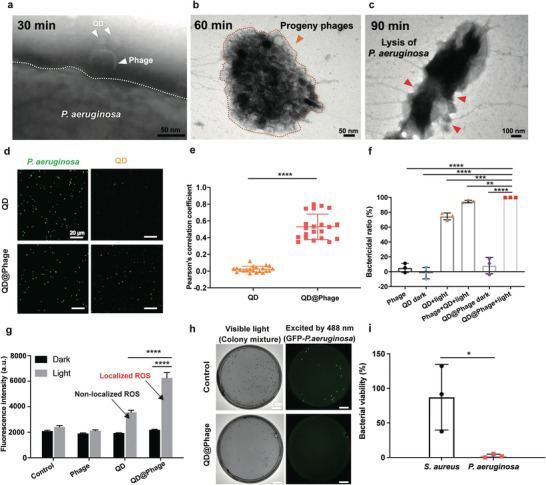
In vitro antibacterial profile of QD@Phage. TEM images revealing PA‐PCT processes of QD@Phage: a) host bacteria binding, b) progeny phages releasing, and c) lysis of a bacterium. Scale bar: 50 nm in (a) and (b); 100 nm in (c). d) Confocal scanning microscopy (CLSM) images of QD and QD@Phage treated GFP‐P. aeruginosa. GFP‐P. aeruginosa (green fluorescence); QD (yellow fluorescence). Scale bar: 20 µm. e) Colocalization analysis as determined by the Pearson's correlation coefficient statistically analyzed from CLSM images. The data are presented as mean ± SD, n = 20. f) Bactericidal ratios for phage, QD, phage+QD, and QD@Phage against GFP‐P. aeruginosa under different conditions after 90 min of incubation. The data are presented as mean ± SD, n = 3. g) Intracellular ROS level of GFP‐P. aeruginosa after co‐incubation with phage, QD, and QD@Phage, with or without light irradiation, for 90 min using 2′,7′‐dichlorodihydrofluorescein diacetate (DCF‐DA) assay kit. The data are presented as mean ± SD, n = 3. h) Specific antibacterial test of QD@Phage by imaging of GFP‐P. aeruginosa and MRSA, with visible light representing a mixture of bacteria, and the green fluorescence excited by 488 nm irradiation representing the GFP‐P. aeruginosa. Scale bar: 2 cm. i) Bacterial viability of GFP‐P. aeruginosa and MRSA after the QD@Phage light treatment. The PBS treatment served as the control group in all experiments. The data are presented as mean ± SD, n = 3. **p < 0.01; ***p < 0.001; ****p < 0.0001 by one‐way ANOVA followed by Dunnett's post hoc test for data in (e–g), *p < 0.05 by t‐test for data in (i).