
Figure 3.
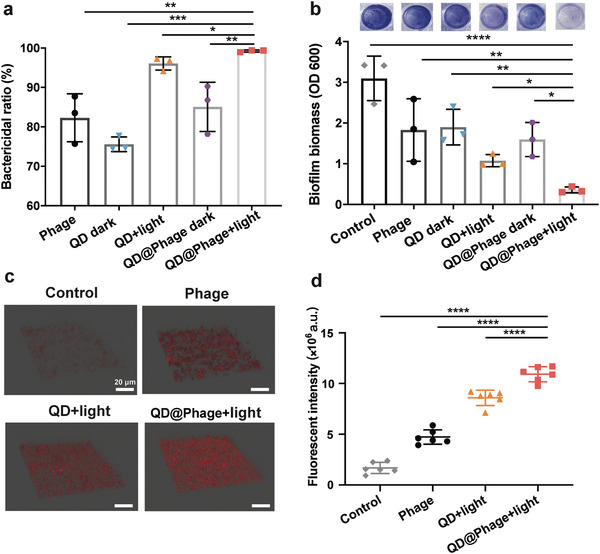
In vitro antibiofilm activity of QD@Phage. a) The biofilm bactericidal ratio of phage, QD, and QD@Phage under different conditions after 24 h of incubation. The data are presented as mean ± SD, n = 3. b) Biofilm biomass quantification using crystal violet staining after various treatments. The data arepresented as mean ± SD, n = 3. c) Confocal microscopy images of dead cells in the biofilm structure after treatments by phage, QD, and QD@Phage under different conditions. Dead cells are labeled in red with propidium iodide (PI). Scale bar: 20 µm. d) Semiquantitative statistics of dead cells' fluorescence intensity in the biofilm structure in (c). The PBS treatment served as a control group in all experiments. The data are presented as mean ± SD, n = 6. *p < 0.05; **p < 0.01; ***p < 0.001; ****p < 0.0001 by one‐way ANOVA followed by Dunnett's post hoc test for data in (a), (b), and (d).