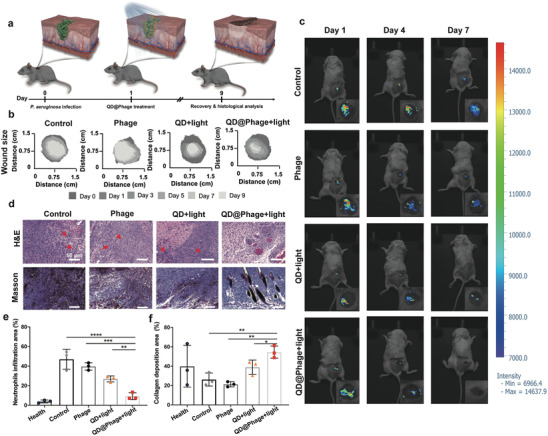
Figure 4.

In vivo antibacterial profile of QD@Phage. a) Schematic illustration of mouse wound infection model and the process of treatment with QD@Phage. b) Traces of wound area after 9 days of various treatments. c) Representative fluorescence imaging signals for GFP‐P. aeruginosa in the wound during treatment. d) Representative histological photomicrographs of epidermal sections of GFP‐P. aeruginosa‐infected wound after various treatments, with Hematoxylin and Eosin (H&E) and Masson staining. Red arrows highlight typical neutrophils. Scale bar: 50 µm. Percentage of e) neutrophil infiltration area and f) collagen deposition area after various treatments, based on corresponding images of H&E staining and Masson trichrome staining. The PBS treatment served as control group. The data are presented as mean ± SD, n = 3. *p < 0.05; **p < 0.01; ***p < 0.001; ****p < 0.0001 by one‐way ANOVA followed by Dunnett's post hoc test for data in (e) and (f).
