
Figure 4.
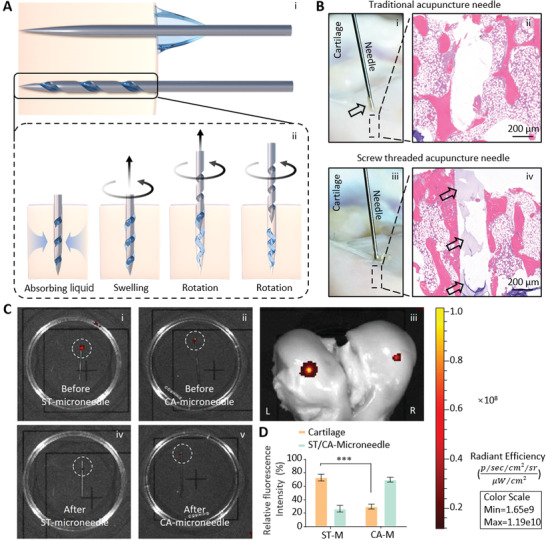
The hydrogel was transported by the ST‐needle. A) Schematic diagram of the ST‐needle transport hydrogel. i) The CA‐needle could not transport the hydrogel into the tissue, while the ST‐needle successfully transported the hydrogel into the tissue. ii) The dried hydrogel absorbed liquid from the tissue, which swelled to make close contact with the surrounding tissue. The ST‐needle rotated and withdrew, leaving the hydrogel in the tissue (The blue arrows represent the fluid absorbed by the hydrogel in the surrounding tissue). B) In vitro experiment verified the effect of ST‐needle transport hydrogel. i) The hydrogel‐loaded CA‐needle was inserted into the pig cartilage (the black arrow indicated hydrogel blocked by cartilage). ii) the histologic section of subchondral bone. iii) The hydrogel‐loaded ST‐needle was inserted into the pig cartilage. iv) The histologic section of subchondral bone (the black arrow indicated hydrogel that had been successfully transported to the subchondral bone). C) Cy‐7‐labeled hydrogel was used to verify that the ST‐needle could transport more hydrogel into the cartilage than the CA‐needle. D) Quantitative analysis of fluorescence intensity (n = 3). (*** P < 0.001).