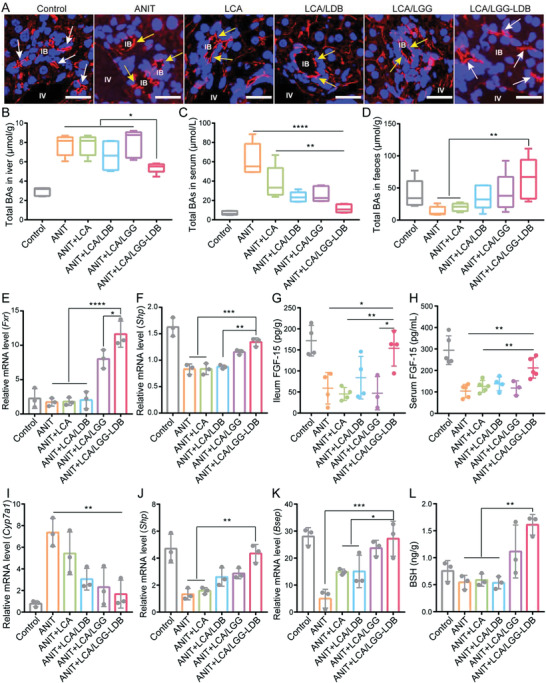
Figure 3.

The intervention mechanisms of LCA/LGG‐LDB in ANIT‐induced cholestasis and liver injury. A) Hepatic immunofluorescence staining of ZO‐1 in different treatment groups (White arrows: double rail; Yellow arrows: mono rail; Scale bar: 20 µm). Total BAs in B) liver, C) serum, and D) feces in different treatment groups. Relative mRNA expressions of E) Fxr, and F) Shp in intestine. The concentration of FGF‐15 in G) ileum and H) liver. Relative mRNA expressions of I) Cyp7a1, J) Shp, and K) Bsep in liver. L) BSH level in feces. The data were presented as the mean ± s.d., n = ≈3–5. The statistical significance was calculated via one‐way ANOVA with Tukey's multiple comparisons test. *P < 0.05, **P < 0.01, ***P < 0.001, ****P < 0.0001.
