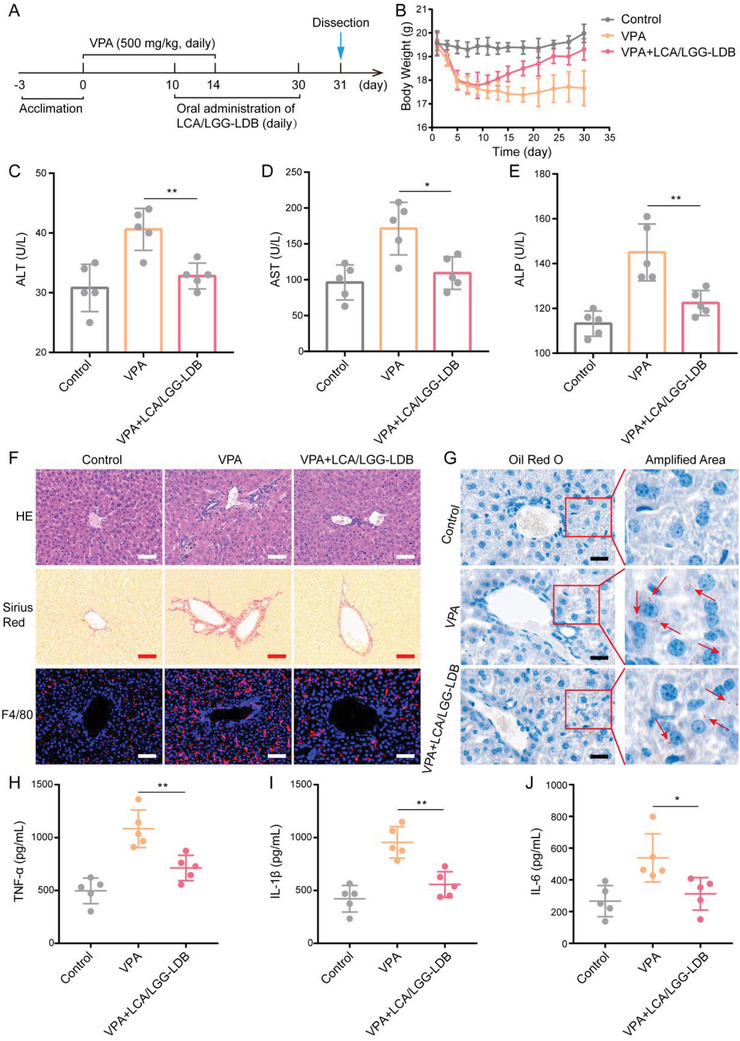
Figure 5.

Remission of VPA‐induced liver hepatotoxicity by LCA/LGG‐LDB. A) The therapeutic process of VPA‐induced hepatotoxicity using LCA/LGG‐LDB. B) Mouse body weight changes during treatment. The concentration of liver functions‐related enzymes in serum including C) ATL, D) AST, and E) ALP. F) Hepatic pathological section of H&E staining, Sirius Red staining and F4/80 marker immunofluorescence staining, respectively (Scale bar: 50 µm). G) Oil red O staining of mouse liver tissues (Scale bar: 20 µm). The concentration of hepatic inflammatory factors including H) TNF‐α, I) IL‐1β, and J) IL‐6, respectively. The data were presented as the mean ± s.d., n = 5. The statistical significance was calculated via one‐way ANOVA with Tukey's multiple comparisons test. *P < 0.05, **P < 0.01.
