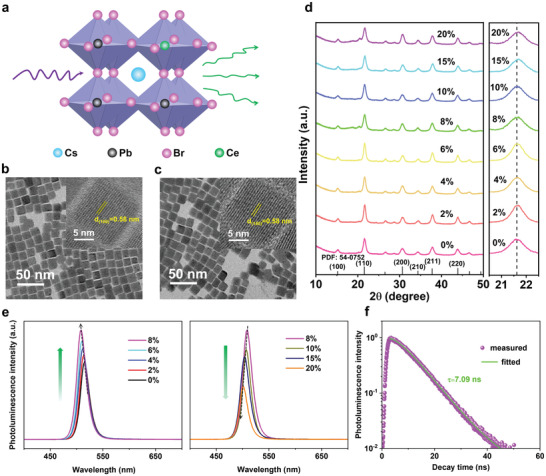
Figure 1.

Crystal structure and photoluminescence (PL) characterization of Ce3+‐doped CsPbBr3 NCs. a) Crystal structure of the Ce3+ doped CsPbBr3 NCs. b) TEM image of Ce3+‐doped (8%) CsPbBr3 NCs and corresponding HRTEM image (top right). c) TEM image of CsPbBr3 NCs and corresponding HRTEM image (top right). d) Powder XRD pattern of the undoped and Ce3+‐doped CsPbBr3 NCs. e) PL spectra of the CsPbBr3 NCs with different Ce3+ ions content. f) PL decay curve of Ce3+‐doped (8%) CsPbBr3 NCs.
