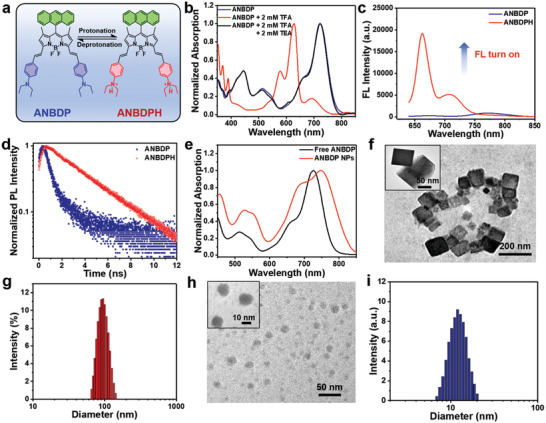
Figure 1.

a) Protonation and deprotonation process of ANBDP. b) Normalized absorption spectra of ANBDP upon the addition of TFA and TEA. c) Fluorescence (FL) spectra of ANBDP and ANBDPH at 5 × 10‐6 m. d) Transient fluorescence lifetime of ANBDP and ANBDPH. e) Normalized absorption of free ANBDP and ANBDP NPs. f,h) TEM images of ANBDP NPs at pH 7.4 and 5.0. g,i) DLS size distribution of ANBDP NPs at pH 7.4 and 5.0.
