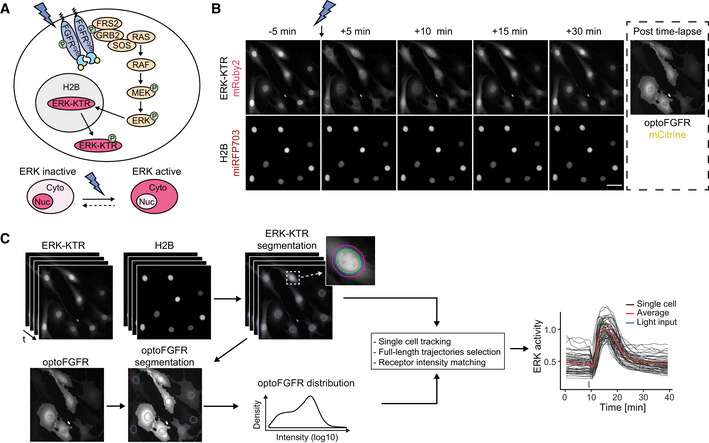
Figure 1. An optogenetic actuator‐biosensor genetic circuit to study input‐dependent ERK dynamics.

- Schematic representation of the optoFGFR system consisting of the optogenetic FGF receptor (optoFGFR) tagged with mCitrine, the ERK biosensor (ERK‐KTR) tagged with mRuby2, and a nuclear marker (H2B) tagged with miRFP703.
- Time‐lapse micrographs of ERK‐KTR dynamics in response to a 470‐nm light pulse. Using a 20× air objective, ERK‐KTR and H2B channels were acquired every 1 min and the optoFGFR channel was acquired once at the end of the experiment. Scale bar: 50 μm.
- Image analysis pipeline developed to quantify single‐cell ERK dynamics. Nuclear and cytosolic ERK‐KTR signals were segmented based on the H2B nuclear mask. Single‐cell ERK activity was then calculated as the cytosolic/nuclear ERK‐KTR ratio. Single‐cell optoFGFR intensity was measured under the cytosolic ERK‐KTR mask and used as a proxy for single‐cell optoFGFR expression.
