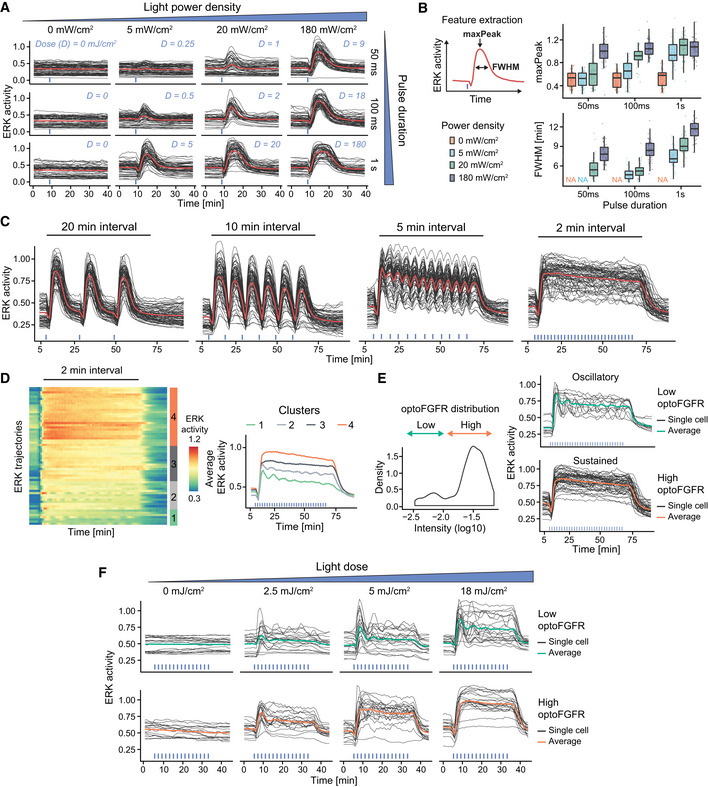
ERK responses to increasing light power densities and pulse durations of 470‐nm transient light input. The light dose “D” is calculated as the product of the power density and pulse duration.
Quantification of the maxPeak (maximal ERK amplitude of the trajectory) and the FWHM (full width at half maximum) of single‐cell ERK responses shown in (A) (N
min = 40 cells per condition from one replicate, boxes indicate the upper and lower quartiles, the central bands indicate the median and whiskers extend to individuals up to 1.5 interquartile away from the median).
ERK responses to 470 nm light pulses delivered every 20, 10, 5, and 2 min, respectively (D = 18 mJ/cm2).
Hierarchical clustering (Euclidean distance and Ward D2 linkage) of trajectories from the 2‐min interval stimulation shown in (C) (referred to as “sustained”) (N = 60 cells). The number of clusters was empirically defined to resolve the different ERK dynamics. The average ERK responses per cluster are displayed on the right.
Using the log10 intensity of optoFGFR‐mCitrine (left panel), trajectories shown in (D) are separated in low and high optoFGFR cells (right panel).
ERK responses to increasing doses of sustained optoFGFR input. Single‐cell ERK trajectories were divided in low (top panel) and high (bottom panel) optoFGFR expression.

