-
A, B
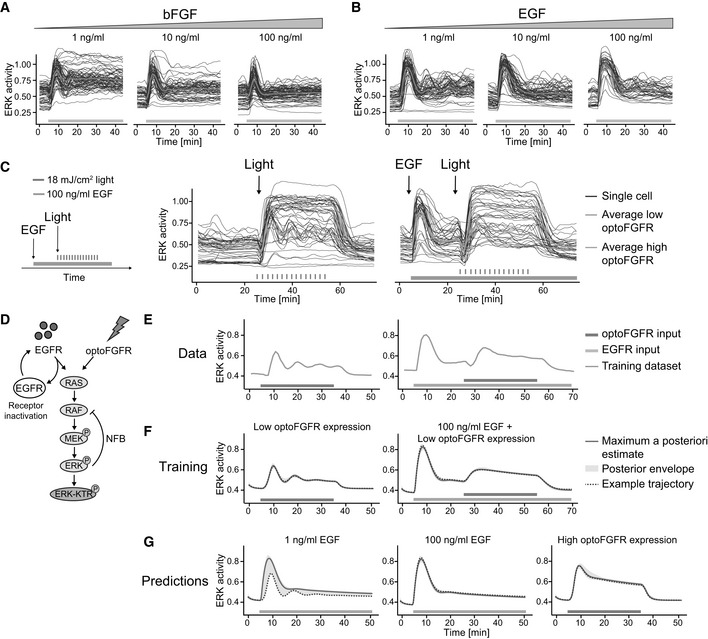
Single‐cell ERK trajectories under increasing concentrations of sustained (A) bFGF or (B) EGF input added at t = 5 min.
-
C
ERK responses of cells stimulated with sustained optoFGFR input (D = 18 mJ/cm2) at t = 24 min without or with 100 ng/ml EGF sustained pre‐stimulation at t = 5 min. Average ERK responses for optoFGFR high and low expression levels are shown (N = 20 cells for low and high optoFGFR, randomly selected out of at least 80 cells).
-
D
Mathematical model topology consisting of the RAS GTPase, the MAPK three‐tiered (RAF, MEK, ERK) network and the ERK‐KTR reporter. EGFR and optoFGFR inputs both activate the RAS/RAF/MEK/ERK cascade and the ERK‐RAF NFB. EGFR activity is under receptor‐dependent regulations.
-
E
Training dataset consisting of the average ERK responses evoked by sustained low optoFGFR input with or without pre‐stimulation with 100 ng/ml sustained EGF.
-
F
Simulation of ERK responses from the training dataset, including the maximum a posteriori (MAP) estimate, the posterior envelope indicating the predictive density of our estimation, as well as an example trajectory.
-
G
Predictions of the model for ERK responses evoked by 1 ng/ml EGF, 100 ng/ml EGF and sustained high optoFGFR inputs. Note that for low EGFR input (1 ng/ml), the model predicts both adaptive and oscillatory ERK responses.

