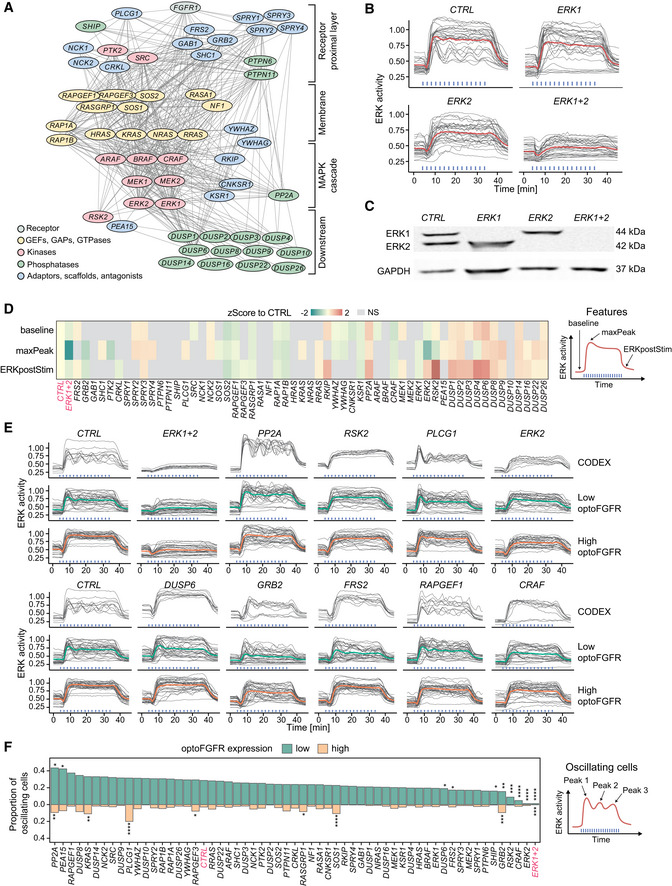
Figure 4. RNA interference screen reveals that ERK dynamics remain unaffected in response to perturbation of most MAPK signaling nodes.

- RNAi perturbation targets referred to by their protein names. Nodes were spatially grouped based on the hierarchy of interactions within the MAPK network and color‐coded for their function.
- ERK responses to sustained optoFGFR input (D = 18 mJ/cm2) in cells transfected with 10 nM siRNA against ERK1, ERK2 or a 5 nM combination of each (ERK1+2). A non‐targeting siRNA (CTRL) was used as control (N = 15 cells from low and high optoFGFR levels).
- Western blot analysis of cells transfected with 10 nM siRNA against ERK1, ERK2 or a 5 nM combination of each (ERK1+2).
- Z‐Score evaluation of the baseline, maxPeak and ERKpostStim of single‐cell ERK responses under sustained high optoFGFR input (D = 18 mJ/cm2). The z‐score was calculated by comparing each RNAi perturbation to the CTRL KD (N min = 126 cells per treatment, from three technical replicates). Non‐significant (NS) results are in gray (see Fig EV3A for statistical results).
- Single‐cell ERK trajectories (sustained optoFGFR input, D = 18 mJ/cm2) for the RNAi perturbations classified with the highest accuracy by CODEX. Top lines show single‐cell ERK trajectories for which CODEX had the highest classification confidence in the validation set (N = 10). Bottom lines show single‐cell ERK trajectories for low and high optoFGFR cells (N = 30 for each condition, randomly selected out of at least 212 cells per perturbation from three technical replicates). For easier visualization, the CTRL condition is shown twice.
- Proportion of oscillating cells (trajectories with at least three peaks) per RNAi perturbation for low and high optoFGFR expression (sustained optoFGFR input, D = 18 mJ/cm2, N min = 61 cells for low and 126 for high optoFGFR per perturbation from three technical replicates). Perturbations were ordered based on the proportion of oscillating cells with low optoFGFR expression. Statistical analysis was done using a pairwise t‐test, comparing each perturbation against the CTRL for each receptor level independently (*< 0.05, **< 0.005, ***< 0.0005, ****< 0.00005, FDR P‐value correction method).
