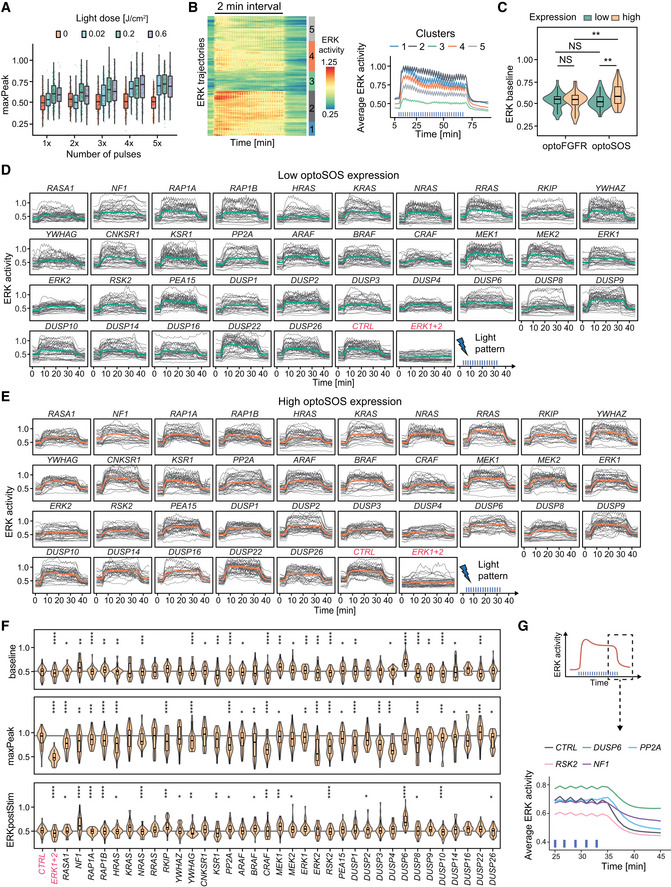
Figure EV4. Direct optogenetic activation of RAS highlights different ERK dynamics phenotypes than optoFGFR input.

-
AQuantification of the maxPeak of ERK dynamics evoked by transient optoSOS input using different light doses (color code) and different numbers of 100 ms pulses (x‐axis) repeated every 20 s (N min = 136 cells from one replicate).
-
BHierarchical clustering (Maximum distance and Ward D2 linkage) of ERK responses under 2‐min interval optoSOS input shown in Fig 5C (D = 0.6 J/cm2, N = 90 cells). The number of clusters was empirically defined to resolve the different ERK amplitudes. Average ERK responses per cluster are displayed on the right.
-
CQuantification of the baseline of single‐cell ERK responses under sustained optoFGFR (Fig 2F, D = 18 mJ/cm2) and optoSOS (Fig 5D, D = 0.6 J/cm2) input for low or high expression of each optogenetic system (N = 40 cells per condition). Statistical analysis was done using a Wilcoxon test, comparing each condition to each other (N min = 48 cells per condition, NS: non‐significant, **< 0.005, FDR P‐value correction method).
-
D, EERK responses under RNAi perturbations targeting MAPK signaling nodes active below RAS (sustained optoSOS input, D = 0.6 J/cm2, N = 40 cells from low (D) and high (E) optoSOS expressing cells for each perturbation, randomly selected out of at least 193 trajectories from three technical replicates).
-
FViolin plot distributions of the baseline, maxPeak and ERKpostStim of single‐cell ERK responses under sustained high optoSOS input (D = 0.6 J/cm2, N min = 33 cells with high optoSOS expression per treatment, from three technical replicates). Statistical analysis was done using a Wilcoxon test comparing each treatment to the control (*< 0.05, **< 0.005, ***< 0.0005, ****< 0.00005, FDR P‐value correction method).
-
GAverage ERK responses during a selected time window (dashed line, upper panel) for selected siPOOLs affecting ERK adaptation (ERKpostStim in Fig 5F) (sustained optoSOS input, D = 0.6 J/cm2, N min = 270 cells per condition from three technical replicates).
Data information: In (A), (C), and (F), boxes indicate the upper and lower quartiles, the central bands indicate the median, and whiskers extend to individuals up to 1.5 interquartile away from the median.
