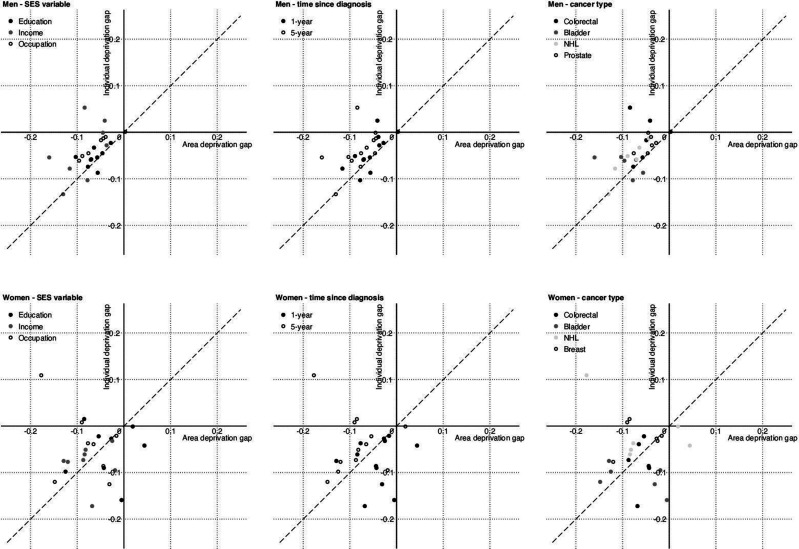
Figure 4.
Comparison of individual versus area-level deprivation gaps. Deprivation gaps are negative where survival is lower in the more deprived groups. The dashed line indicates where the gap according to individual socioeconomic group and the area-level index is equal (ie, y=x). Data source: Office for National Statistics Longitudinal Study. NHL, non-Hodgkin’s lymphoma; SES, socioeconomic status.

