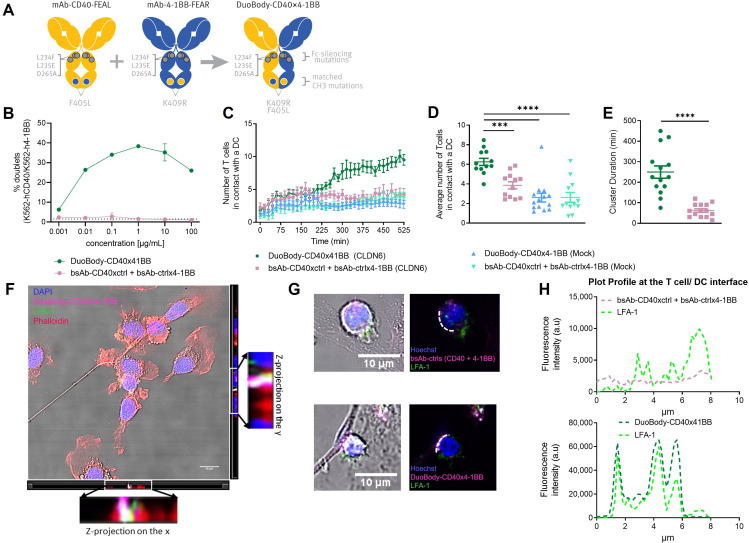
Figure 1.
DuoBody-CD40×4-1BB reinforces the immunological synapse through target crosslinking. (A) Generation of DuoBody-CD40×4-1BB by cFAE of Fc-silenced mAb-CD40 and mAb-4-1BB. The parental antibodies contain matched mutations in the CH3 domain (F405L/K409R) that drive heterodimerization of the Fab arms and formation of bispecific molecules during cFAE, as well as Fc-silencing mutations (L234F, L235E and D265A) that abrogate binding to FcγR and C1q. (B) Simultaneous binding of DuoBody-CD40×4-1BB to human CD40-transgenic K562 cells labeled with CellTrace Violet and human 4-1BB-transgenic K562 cells labeled with CellTrace FarRed was analyzed by flow cytometry. Double-positive doublets were quantified as percentage within the live cell population (mean±SD; triplicate wells). (C–E) T cells electroporated with a CLDN6-specific TCR were cocultured with CLDN6-electroporated or mock-electroporated autologous iDCs in the presence of 0.125 µg/mL DuoBody-CD40×4-1BB or control antibodies, and T-cell/iDC clusters were visualized over time by live-cell imaging. Quantification of the number of T cells in contact with a given DC over time (C), or on average (D), as well as the duration of these DC/T-cell clusters (E) is shown. Error bars represent SD. ****P<0.0001; ***p<0.001; one-way ANOVA with Dunnett’s multiple comparisons test (D). ****P<0.0001; Mann-Whitney test (E). (F) Single Z plane of merged brightfield and fluorescent image of iDC cocultured with preactivated CD8+ T cells in the presence of Alexa Fluor 647-conjugated DuoBody-CD40×4-1BB (magenta)and LFA-1 (in green) antibodies, on the x and y axes the z-stack of the same picture with the relative zoom in. Nuclei were counterstained with Hoechst (in blue). (G) Representative fluorescent images of cocultures as in (E), in the presence of DuoBody-CD40×4-1BB or control antibodies. The white dashed line represents the interface between the DC and T cell. Scale bars: 10 µm. (H) LUT profile of LFA-1 and DuoBody-CD40×4-1BB or the combination of bsAb-CD40xctrl and bsAb-ctrlx4-1BB at the DC-T-cell interface, indicated by the white dashed line. ANOVA, analysis of variance; cFAE, controlled Fab-arm exchange; iDC, immature dendritic cell; LFA-1, leukocyte functional antigen 1; LUT, look-up table.

