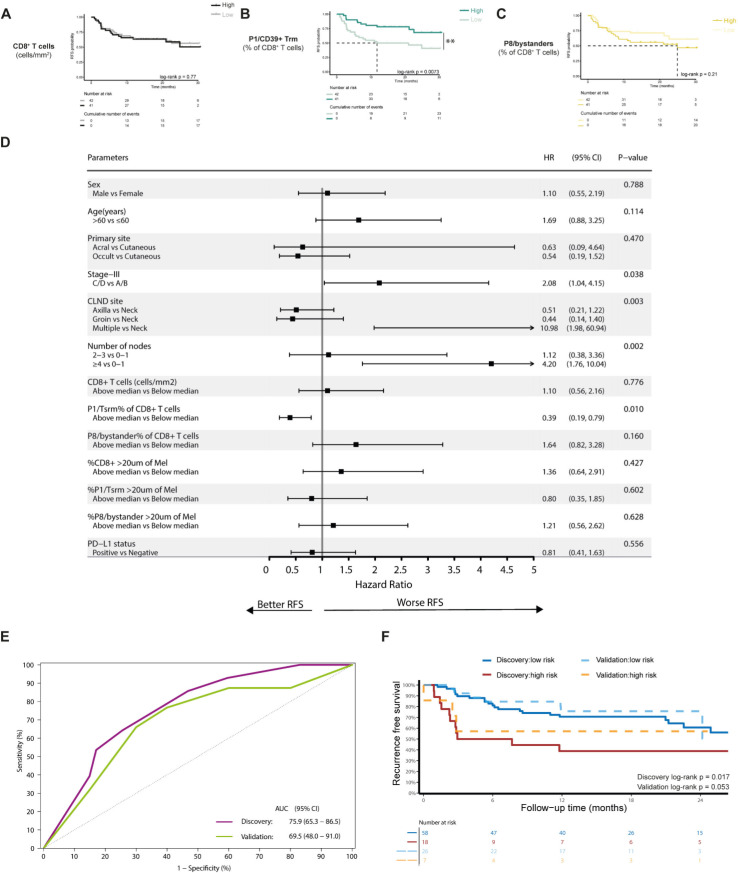
Figure 4.
High P1/CD39+ Trm is significantly associated with RFS. Kaplan-Meier curves were plotted for patients with high CD8+ (A), P1 (B), P8 (C) cell counts against low counts. High versus low groups were determined by the median value for each cell population. Median RFS is shown where it is reached. Statistical differences were calculated using a log-rank test. (D) A forest plot was created from univariable Cox regression analysis. Horizontal bars indicate 95% CI. (E) The receiver operating characteristic curve shows the predictive capability of a predictive multivariable model for RFS including P1/CD39+ Trm% of CD8+ T cells, stage and CLND (discovery n=64, validation n=33). (F) Calibration plot compares RFS Kaplan-Meier curves for risk groups as defined by the MVA model in the discovery and validation cohorts. AUC, area under the curve; CLND, completion lymph node dissection; P1, population 1; P8, population 8; RFS, recurrence-free survival; Trm, tissue-resident memory cell.

