
Extended Data Fig. 6. Details of DNA cyclization experiments.
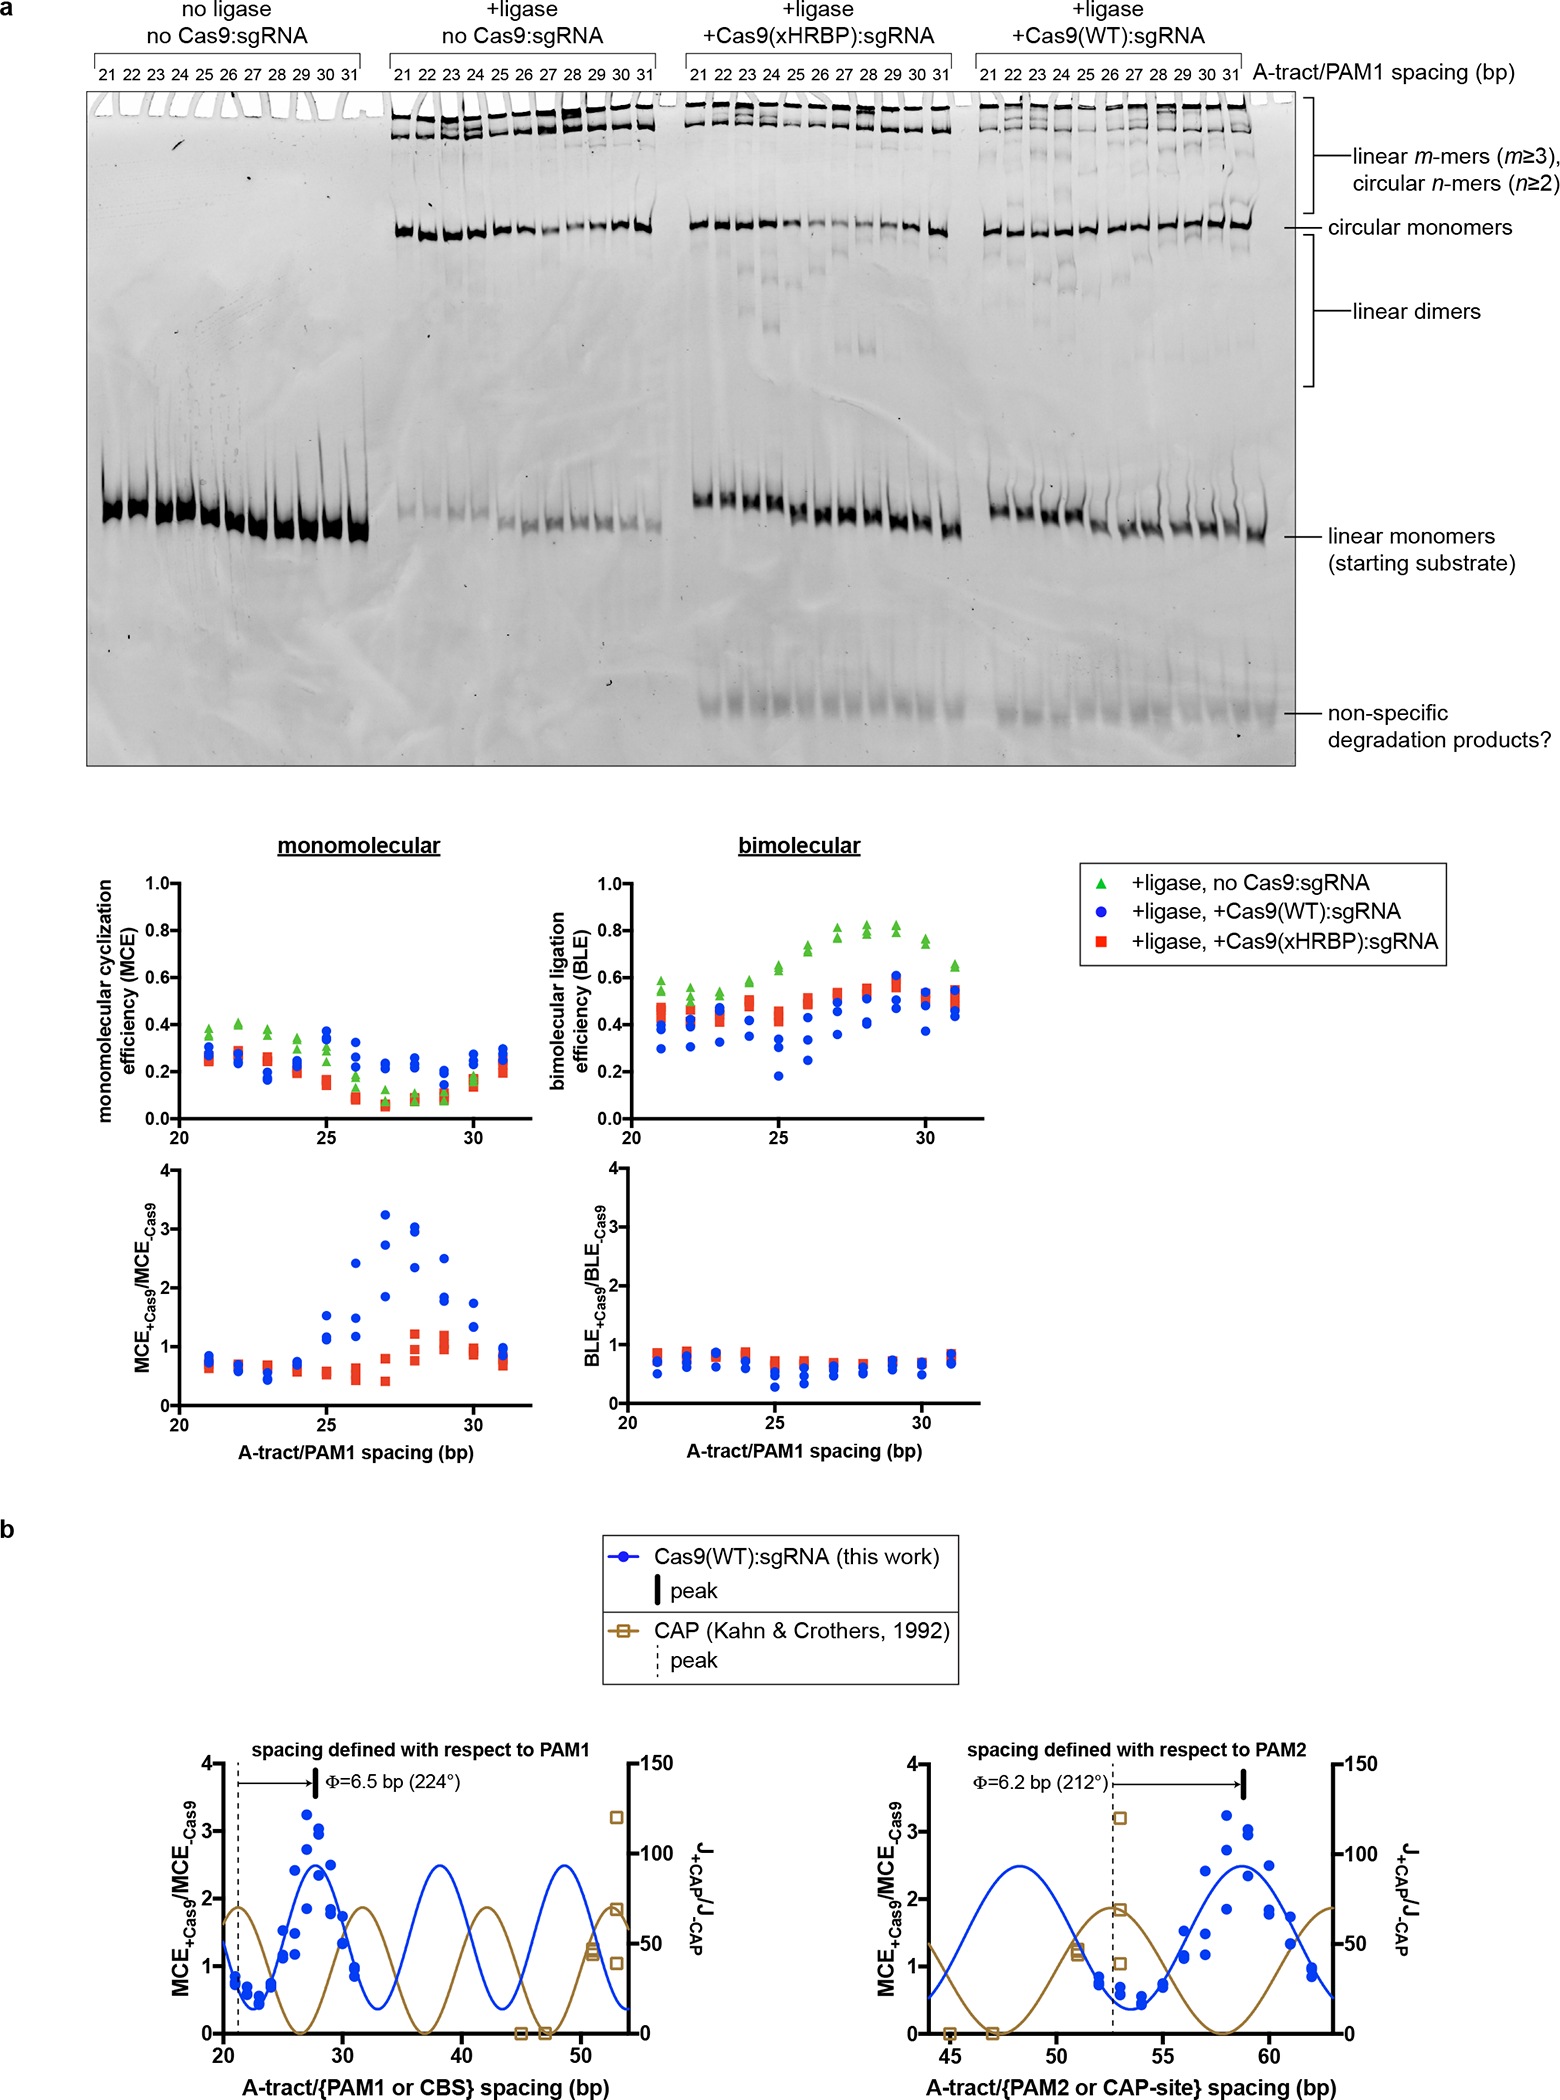
a, Fluorescence image and analysis of native PAGE gel resolving ligation products. Gel represents one replicate. Three replicates are plotted on the graphs. The polymeric/cyclized band assignments were made by reference to the relative electrophoretic mobilities observed in Kahn & Crothers, 1992. b, Comparison of Cas9:DNA cyclization data to CAP:DNA cyclization data. The depicted model is , with the following constraints: . The average of 224° and 212° is reported in Fig. 4c. J, J-factor (defined in Kahn & Crothers, 1992); Φ, phase difference; CBS, CAP-binding site.