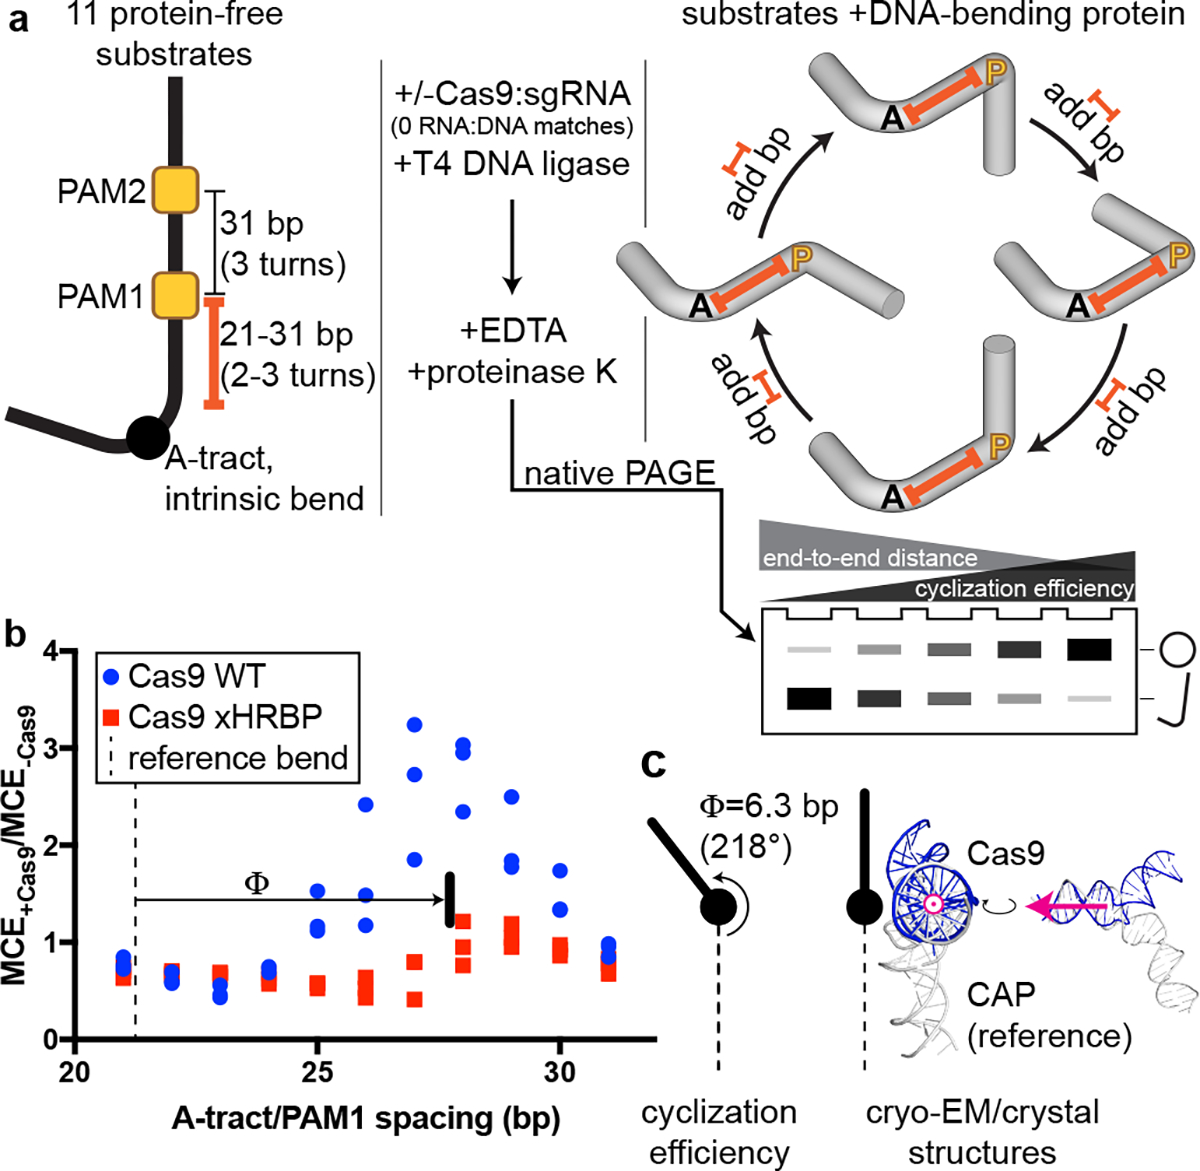
Fig. 4 |. DNA cyclization efficiency experiments.

a, Substrate structure and experimental pipeline. Black A, A-tract; yellow P, PAM; orange spacer, A-tract/PAM1 distance (21–31 bp). For simplicity, bending is only depicted at a single PAM in the cylindrical volume illustrations. Substrates that are more S-shaped (left side of the cycle diagram/gel) cyclize more slowly than substrates that are C-shaped (right) due to changes in the end-to-end distance of the molecules. When base pairs are added to the spacer, the cyclization efficiency is expected to rise as the Cas9-induced bend becomes aligned with the A-tract bend, then fall as the bends become misaligned again, in a roughly sinusoidal pattern. b, Cas9-dependent cyclization enhancement of eleven substrate variants. Three replicates are depicted. MCE, monomolecular cyclization efficiency; xHRBP, mutated helix-rolling basic patch (K233A/K234A/K253A/K263A); Φ, phase difference from reference bend to the Cas9 WT peak. A protein that does not bend the DNA at all would yield the line y=1. A protein that bends DNA in a different direction would yield an x-shifted sinusoid that peaked at a different value of spacer length. c, Comparison of bending phase difference in the cyclization experiments vs. cryo-EM/crystal structures of DNA bends introduced by Cas9 or CAP (PDB 1CGP). See Supplementary Information for discussion of the CAP-based reference bend analysis. The magenta vector superposed on the aligned helices would point toward the A-tract in the cyclization substrates; in the larger structural diagram, it points out of the page.
