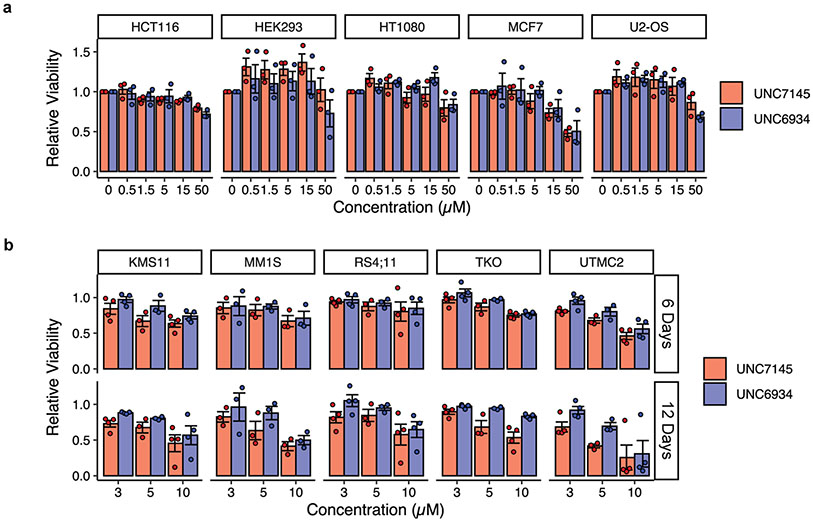
Extended Data Fig. 7 ∣. Cytotoxicity Profiling of UNC6934 and UNC7145.
a, Effect of UNC6934 and UNC7145 on cell viability after a 72-hour treatment. Cells (HCT116, HEK293, HT1080, MCF7 and U2OS lines) were treated with indicated concentrations of either UNC7145 or UNC6934 in 96-well plates and nuclei counted by staining Vybrant™ DyeCycle™ Green Stain and imaging on an IncuCyte live-cell analysis system. Each point represents the average number of cells across fields relative to DMSO treated control (n = 3 independent experiments). Plots show each experiment as a point. Bars represent the mean relative cell number ± sem. b, Effect of UNC6934 and UNC7145 on cell viability after 6- and 12-days treatment. Cells (KMS-11, MM1S, RS4;11, TKO and UTMC2 lines) were treated with indicated concentrations of either UNC7145 or UNC6934 in 12-well plates and percentage of viable cells was measured by CellTiter-Glo® luminescent cell viability assay. Bar plots show the mean relative viability ± sem (n = 3 or 4 experiments).

