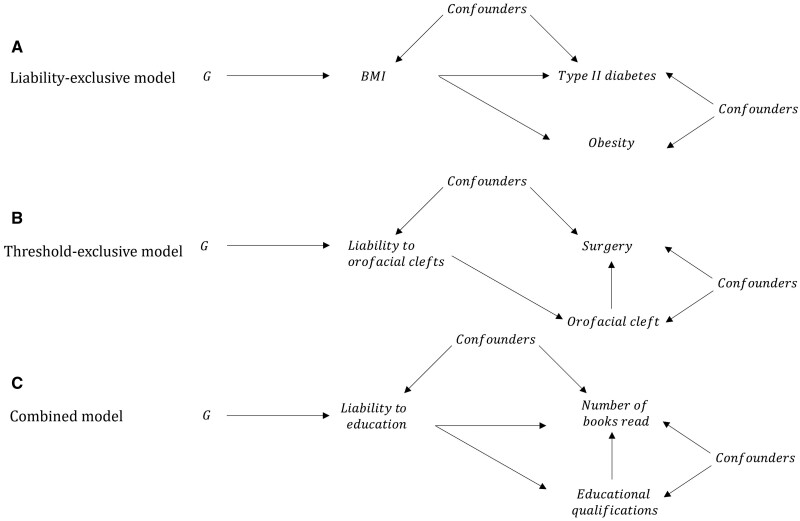
Figure 2.
Causal graph illustrations of interpreting causal relationships between non-continuous exposures and outcomes. Illustrations of the liability-exclusive, threshold-exclusive and combined models for interpreting causal relationships between ordinal categorical exposures and outcomes. (A) Under the liability-exclusive model, liability influences the outcome solely via effects that are independent of the exposure category. For example, an MR study of obesity (i.e. BMI > 30) and Type 2 diabetes would suggest that obesity increases the risk of Type 2 diabetes. However, this effect is likely to be solely due to the effects of continuous body mass index (liability to obesity) rather than threshold effects relating to body mass index categories. (B) In the threshold-exclusive model, liability to the exposure influences the outcome entirely via threshold effects relating to the categories of the exposure (i.e. a stepwise effect). For example, individuals born with an orofacial cleft are likely to have corrective surgery but individuals who do not develop an orofacial cleft will not, irrespective of their underlying liability to orofacial clefts. (C) In the combined model, liability influences the outcome via the categorical exposure and via pathways independently of the categorical exposure. For example, spending longer in full-time education involves reading books but individuals with high liability to educational attainment may also be more likely to read books independently of educational attainment. G, genetic factors; BMI, body mass index.

