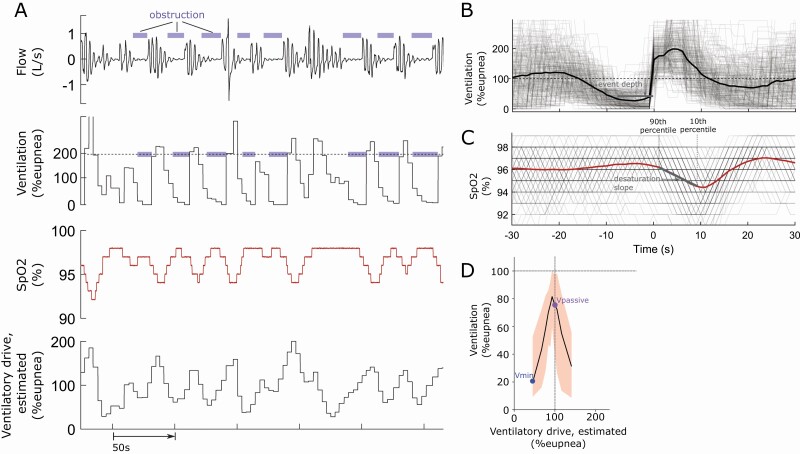
Figure 1.
(A) Raw sample traces of flow, ventilation, SpO2, and modeled (estimated) ventilatory drive during a series of respiratory events. (B) To compute event depth, ventilation profiles for each respiratory event are aligned to the terminal breath of the event and then ensemble averaged. The event depth is then calculated as the mean reduction (from eupnea) in ensemble averaged ventilation during the event. (C) To compute desaturation slope, saturation profiles for each respiratory event were synchronized at event termination and ensemble averaged. Desaturation slope was measured as the change in oxygen saturation from the 90th (i.e. event start) to the 10th (i.e. event end) percentile of the ensemble averaged saturation profile during the event, divided by time between these points. (D) The plot of ventilation as a function of ventilatory drive illustrating the derivation of Vpassive and Vmin as the (median) ventilation observed at eupneic drive and at minimal drive (lowest decile), respectively.

