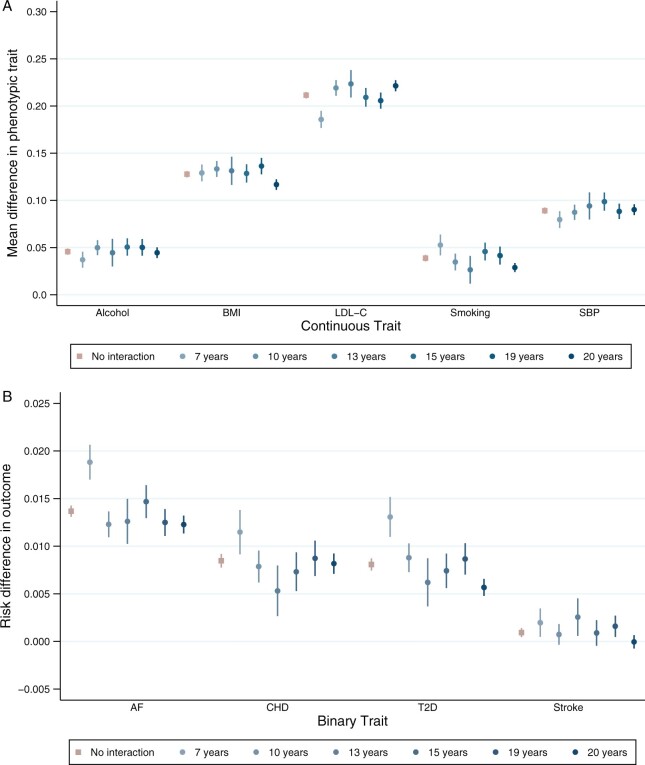
Figure 2.
Association between polygenic scores for susceptibility to cardiovascular risk and phenotypic measure of each risk factor, stratified by educational attainment demonstrating effect modification on the additive scale. Analyses adjusted for age, sex and 40 genetic principal components. Alcohol (drinks per week) PEM = 0.384; body mass index (BMI) PEM = 0.036; low-density lipoprotein cholesterol (LDL-C) PEM = 1.12 × 10⁻⁴; lifetime smoking behaviour PEM = 0.001; systolic blood pressure (SBP) PEM = 0.104; atrial fibrillation (AF) PEM = 9.03 × 10⁻⁸; coronary heart disease (CHD) PEM = 0.103; type 2 diabetes (T2D) PEM = 3.23 × 10⁻¹⁰; stroke PEM = 0.036. PEM = P-value for effect modification

