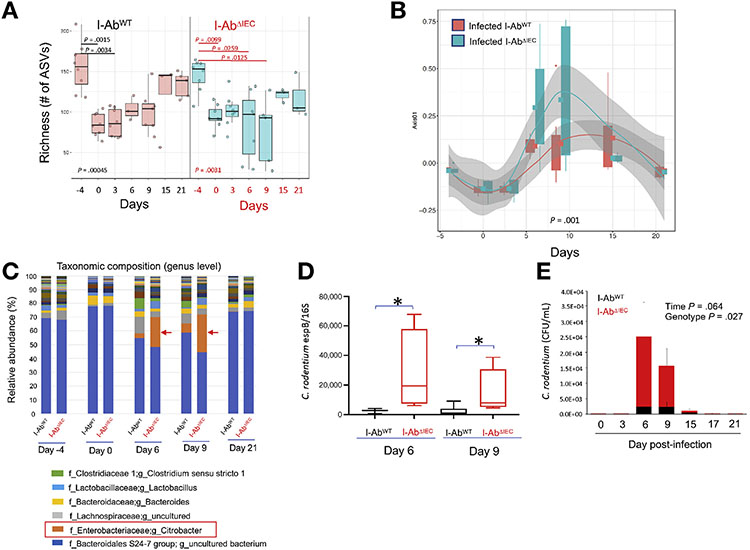
Figure 6.
16S ribosomal RNA amplicon profiling in C rodenfium–infected I-AbWT and I-AbΔIEC mice. (A) Richness presented as the number of amplicon sequence variant (ASVs) was calculated in samples collected before (days −4 and 0) and after oral gavage with C rodenfium at indicated timepoints. Each box represents 75th and 25th percentile, line indicates the median, and whiskers indicate the extreme values. Kruskal-Wallis test P values are indicated. Bonferroni-adjusted P values above bars indicate statistically significant differences between timepoints calculated using Dunn’s post hoc multiple comparison test. (B) Bray-Curtis dissimilarity (Axis 1) at the indicated time of collection. PERMANOVA (adonis) P value shown at the bottom of the plot. (C) Relative abundance of genera and (D) qPCR detection of C rodentium in fecal samples for day 6 and 9 postinfection using primers for espB gene and normalized against pan-16S qPCR for total bacteria. *P < .05 Student t test. (E) Absolute qPCR quantification of C rodentium in fecal samples in I-AbWT and I-AbΔIEC mice over time. Data were analyzed with mixed effects 2-way analysis of variance. P values for time and genotype as 2 fixed effects are indicated.

