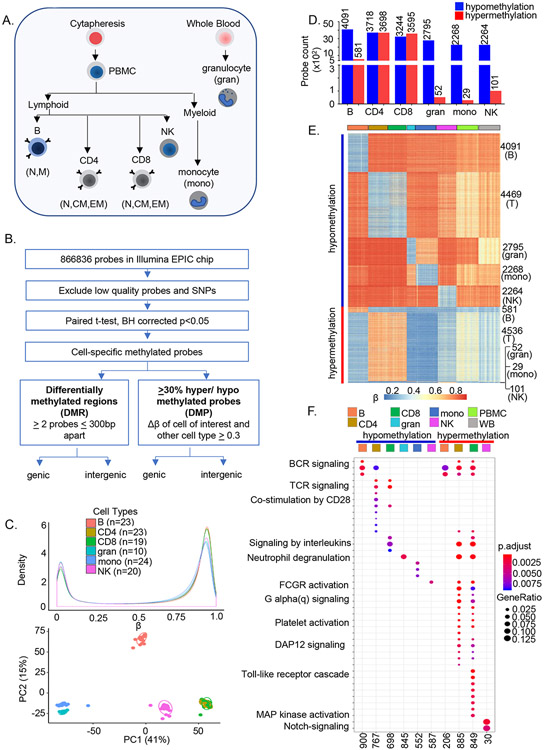
Figure 1. Genome-wide analyses identify cell-specific sites of DNA methylation in human immune cells.
A) Major immune cell types were purified from 55 individuals (age 22-83 years) using a combination of magnetic beads and flow cytometry. Sodium bisulfite treated genomic DNA was hybridized to Illumina MethylationEPIC arrays.
B) After removing the low-quality probes, paired t-test was performed in each cell type comparing β values with every other cell types within an individual in all participants. Multiple testing correction was done at BH adjusted p≤ 0.05. Cell-specific sites of hypo- or hypermethylation were defined as those whose ∣Δβ∣ between a cell type and all other cell types was greater than ≥0.3. Cell-specific differentially methylated probes that were shared between individuals were used for all further analyses. Differentially methylated regions were determined based on the presence of 2 or more differentially methylated probes within 300bp (Figure S1E).
C) Distribution of average β values in each cell type (top, color-coded as indicated). Number of individuals for each cell type is indicated in parenthesis. Principal component analysis of noob-BMIQ normalized β distributions in each cell type (bottom). Each sample is represented by a dot.
D) Cell-specific sites of hypo- (blue) or hypermethylation (red) in human immune cells. Cell-specific sites of methylation were identified for each cell type as described in B with data from 24 individuals. Y axis represents the number of cell-specific probes identified in each cell type. Analysis from an independent cohort of 31 individuals is shown in SI Table 1. CD4 and CD8 were compared with the other 4 cell types.
E) Heatmap representation of cell-specific sites of hypo- and hypermethylation and, for comparison, total peripheral blood mononuclear cells (green) and whole blood (grey). Each row corresponds to a cell-specific probe in the EPIC array and each cell type is represented by 19-23 individuals (columns) except for granulocytes for which n=10.
F) Gene ontology (GO) analysis of genes associated with cell-specific hypo- or hypermethylated sites. Cell-specific hypo- and hypermethylated probes were mapped to genes based on Illumina Infinium MethylationEPIC annotation file. The number of genes corresponding to each cell type that are present in the Gene Ontology database are indicated at the bottom of the figure. These genes were used to identify enriched pathways at FDR adjusted p≤ 0.05; pathway enrichment FDR values are color-coded as indicated. Gene ratios (size of the bubbles) represent the fraction of genes in a cell type that are enriched in a specific pathway. See also Figure S1.

