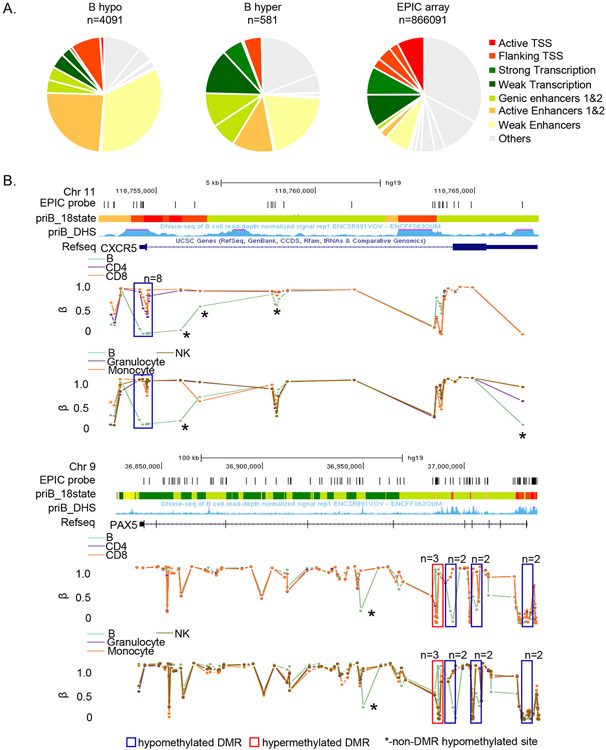
Figure 3. Cell-specific differentially methylated sites map to enhancers and actively transcribed regions.
A) B cell-specific hypo- (left) and hypermethylated (center) probes were assigned to 18 states defined by chromHMM algorithm. The 18-state chromHMM annotation for the B cell genome, based on 6 histone marks, was obtained from the Roadmap Epigenomics project. 8 major chromatin states are color-coded as indicated (details in Methods). Pie charts show the proportion of hypo- or hypermethylated probes in each state. Distribution of all MethylationEPIC array probes in the B cell chromHMM profile is shown on the right.
B) Examples of loci with B cell-specific DMRs. β values for each EPIC probe (vertical lines) associated with CXCR5 and PAX5 loci in all immune cells are shown. The pattern in B cells is compared to T cells (top panel) or monocytes, granulocytes and NK cells (bottom panel) (color-coded as indicated). B cell-specific DMRs in each gene are boxed (n = numbers of differentially methylated probes in each DMR). Asterisks mark B cell-specific hypomethylated sites that are not part of DMRs. Tracks show genomic locations, positions of all MethylationEPIC array probes in the region, chromHMM based annotation (color coded as in A) and DHS in primary human B cells (obtained from ENCODE) for each locus.

