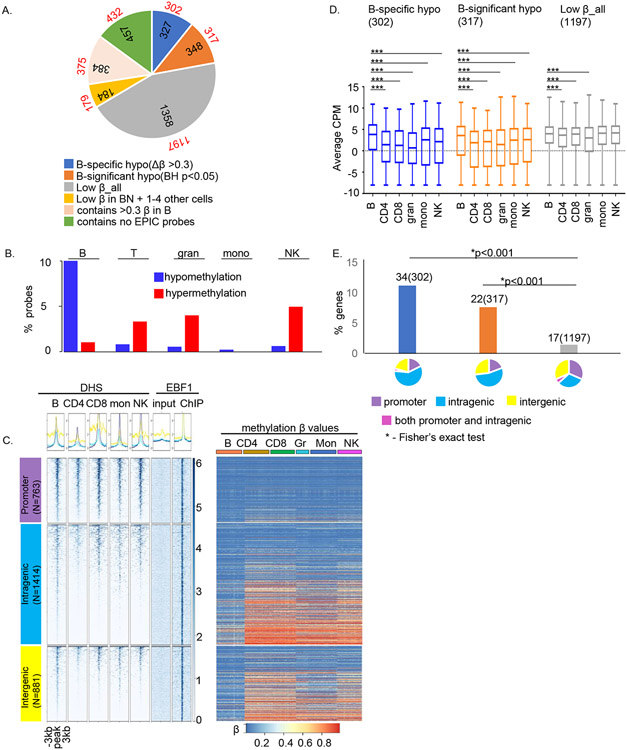
Figure 5. EBF1, a prototypic methylation regulating factor, binds to hypomethylated sites in human B cells.
A) EBF1 ChIP-Seq was carried out with naïve B cells from 3 donors. Pie chart shows the distribution of methylation sites within EBF1-bound regions. Colors represent categories of methylated sites as indicated below the pie charts, numbers within pie chart denote the number of EBF1 peaks in each category and numbers outside the pie chart (in red font) denote number of genes associated with EBF1 peaks after removing overlapping genes as annotated by HOMER. For example, 327 EBF1-bound regions had B cell-specific hypomethylated probes within 1kb of the peak; these peaks corresponded to 302 genes.
B) Distribution of cell-specific hypo- (blue) and hypermethylated (red) probes within ± 0.5kb of EBF1-bound regions in B cells. Y axis represents the proportion of probes in each category compared to the total probes in that category.
C) Epigenetic states of EBF1-bound regions in human B cells. DHS (left) and methylation states (right) of EBF1-bound sites in immune cell types as indicated above each panel. EBF1 binding sites were parsed according to genomic location (left, numbers of EBF1 peaks in each category are shown). Summary plots (top) and heatmaps (bottom) represent DHS data in primary human immune cells that was obtained from ENCODE and is displayed for a ±3kb window surrounding the EBF1 peak summit. The last two columns after the DHS set summarize EBF1ChIP-Seq in mature B cells; EBF1 ChIP peaks were called relative to input DNA. Methylation status of probes that lie within EBF1 peaks is represented as the β value for that site in each immune cell type. The order of EBF1 peaks is the same for both DHS and methylation heatmaps. Rows correspond to EPIC probes and columns correspond to multiple samples from each cell type (n = 23 (naïve B cells), 23 (naïve CD4+ T cells), 19 (naïve CD8+ T cells), 10 (granulocytes), 24 (monocytes) and 20 (NK cells)).
D) Relationship of EBF1 binding and methylation status to gene expression. RNA-Seq analyses of three methylation-based categories of EBF1-bound genes as indicated above each graph. The average expression (Y axis, counts per million) in each cell type was obtained from RNA-seq analyses from 26 donors as described in the text. The horizontal line inside the box is the mean expression for that group, the upper and lower boundaries of the box are the 1st and 3rd quartile of data and the whiskers represent the minimum and maximum expression in the dataset. The significance of the difference in the mean expression of B cells to each of the other 5 cell types was evaluated with independent t-test (*** = p<0.0001).
E) Relationship of B cell-selective gene expression to EBF1 binding and methylation states. Y axis shows proportion of genes in 3 methylation-based categories that are expressed selectively in B cells (see text); numbers of cell-selective genes in each category as well as total numbers of genes in that category (parentheses) are shown above the bars. Categories are color coded as in A: genes with B cell-specific hypomethylated sites within EBF1 peaks (blue), genes with hypomethylated probes (BH p<0.05) in B cells within EBF1 peaks (orange) and genes with uniformly lowly methylated probes in all cell types within EBF1 peaks (grey). Pie charts show the genomic location of EBF1 peaks in each category color-coded as indicated. * indicates Chi-square test p<0.001.

