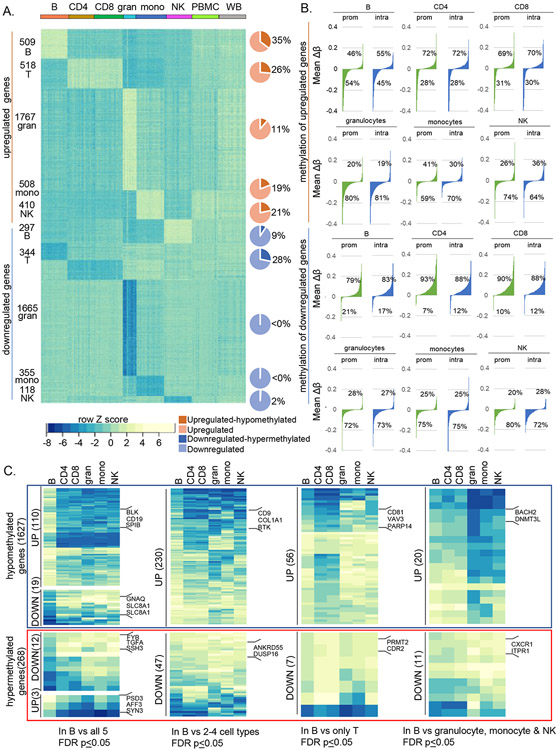
Figure 6. Relationship of cell-specific DNA methylation to gene expression differs between innate and adaptive cell types.
A) RNA-seq was carried out with RNA from each cell type from 26 donors across the age range (Fig S6A-B). Normalized counts per million (CPM) values were compared pairwise within individuals using DESeq2 to identify differentially expressed genes. Genes with ≥ 4-fold change in a cell type compared to all other cell types within an individual and shared by all individuals irrespective of age are referred to as cell-selective. Row Z-score derived from normalized CPM for each cell type as well as PBMC and whole blood are shown for each donor (columns). Darker shade in the pie charts show the proportion of cell-selective genes that are present in the MethylationEPIC array and contain cell-specific hypo- (orange) or hypermethylated (dark blue) sites.
B) Waterfall plots showing promoter and gene body methylation status of cell-selective up- and downregulated genes. The methylation status at promoters (prom) and intragenic regions (intra) for cell-selective genes was calculated as mean Δβ = (average β cell of interest – average β other cells) and arranged in ascending order of Δβ value. Percentage of hypo- (negative Δβ) or hypermethylated (positive Δβ) genes in each cell type are shown. Top two rows show methylation status of genes that are selectively upregulated in each cell type; bottom two rows show methylation status of genes that are selectively downregulated in each cell type.
C) Normalized expression of genes with B cell-specific hypo- or hypermethylated sites. B cell-specific hypo- (4091) and hypermethylated (581) probes mapped to 1627 and 268 genes, respectively, based on MethylationEPIC array annotation. Heatmap shows row Z scores of normalized CPM (scaled as in A) of B cell-specific hypo- (blue box) or hypermethylated (red box) genes with ≥ 4-fold differential expression in B cells compared to all 5 other cell types (left), to 2-4 other cell types (second set), compared to CD4+ and CD8+ T cells (third set) and to innate cell types (right). Representative genes in each category are shown. Number of genes in each category are shown in parentheses. Analyses of selectively-expressed genes in all other human immune cell types are provided in Figures S7A-D.

