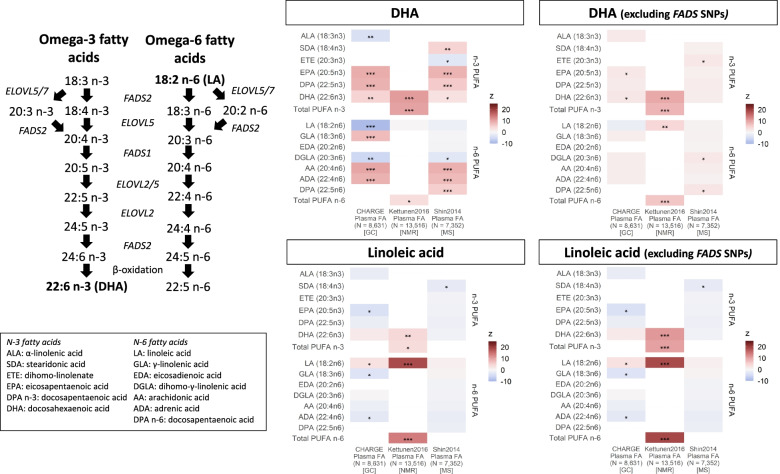
Fig. 1.
Association of genetically predicted DHA and linoleic acid on the circulating PUFA composition among individuals of European ancestry before and after excluding SNPs nearby the FADS locus. Results are expressed as z-statistics (i.e. effect estimate / standard error) for the variation in individual omega-3 and omega-6 fatty acids (y-axis) across multiple data sources (x-axis) according to genetically predicted DHA and linoleic acid. These are expressed using different shades of colours to indicate relative strengths of association; blue, red and grey boxes denote, respectively, decreases, increases and no change in individual PUFA, while white boxes represent missing data. Asterisks indicate P-value: < 5×10⁻⁸ (***), < 5×10⁻⁵ (**) and < 5×10⁻² (*). DHA: docosahexaenoic acid; FADS: fatty acid desaturase genes; ELOVL: elongase genes; SNP: single-nucleotide polymorphism; Plasma FA: plasma fatty acids; N: median sample size used for estimating SNP-fatty acid association; GC: gas chromatography; NMR: nuclear magnetic resonance; MS: mass spectrometry

