FIGURE 2.

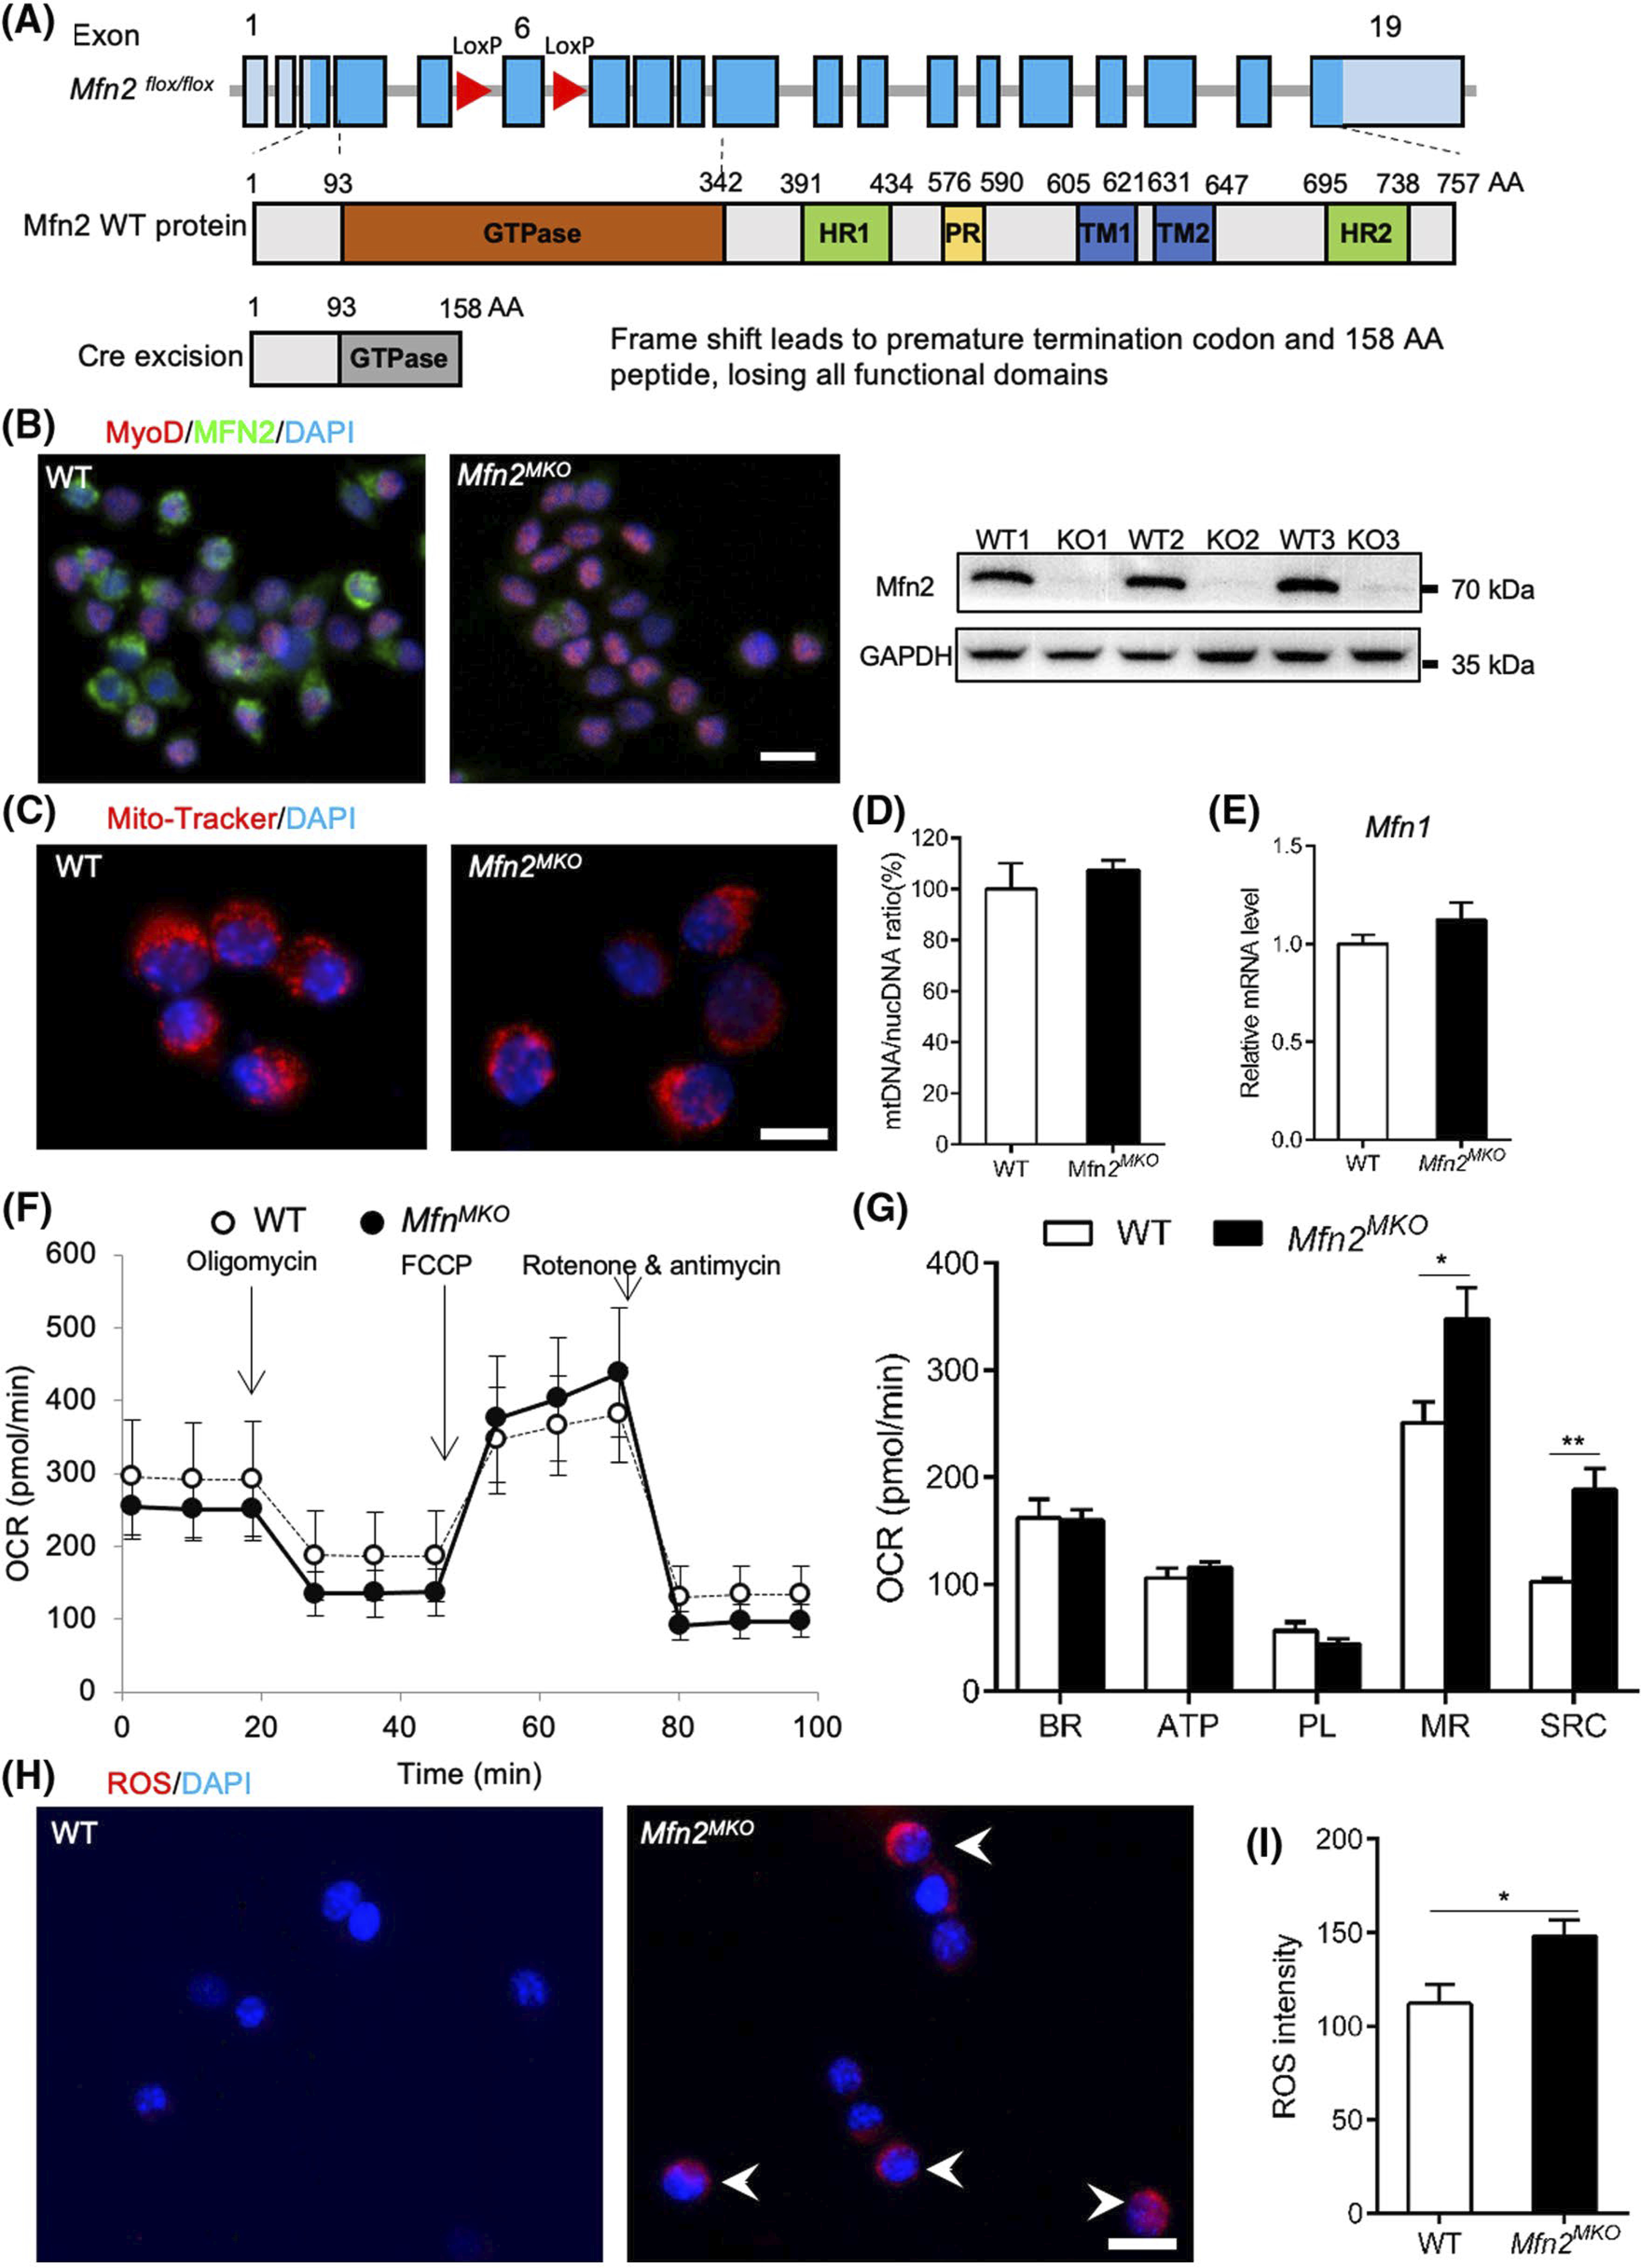
Mfn2-null myoblasts exhibit abnormal respiratory capacity and elevated reactive oxygen species. A, Strategy for myoblast-specific deletion of Mfn2 driven by Myod1Cre (Mfn2MKO). B, Immunofluorescence staining and Western blotting confirm the loss Mfn2 expression in Mfn2MKO primary myoblasts, scale bar: 20 μm. C, Mito-tracker staining of mitochondria in WT and Mfn2MKO myoblasts. Scale bar: 10 μm. D and E, qRT-PCR analysis showing the ratio of mitochondria DNA to nucleotide DNA (E) and mRNA levels of Mfn1 (F) in WT and Mfn2MKO myoblasts (n = 4 for each group). F, Seahorse cell assay showing oxygen consumption rates (OCR) between WT and Mfn2MKO primary myoblasts. G, Quantification of OCR in basal respiration (BR), ATP production (ATP), proton leak (PL), maximal respiration (MR), and spare respiratory capacity (SRC) (n = 6 each group). H, Fluorescence staining showing reactive oxygen species (ROS) in WT and Mfn2MKO myoblasts. White arrows indicate ROS positive myoblasts. Scale bar: 20 μm. I, Quantification of ROS intensity in WT and Mfn2MKO myoblasts (n = 4 each group). All data are shown as mean ± SEM (t test: *P < .05, **P < .01)
