
FIGURE 3.
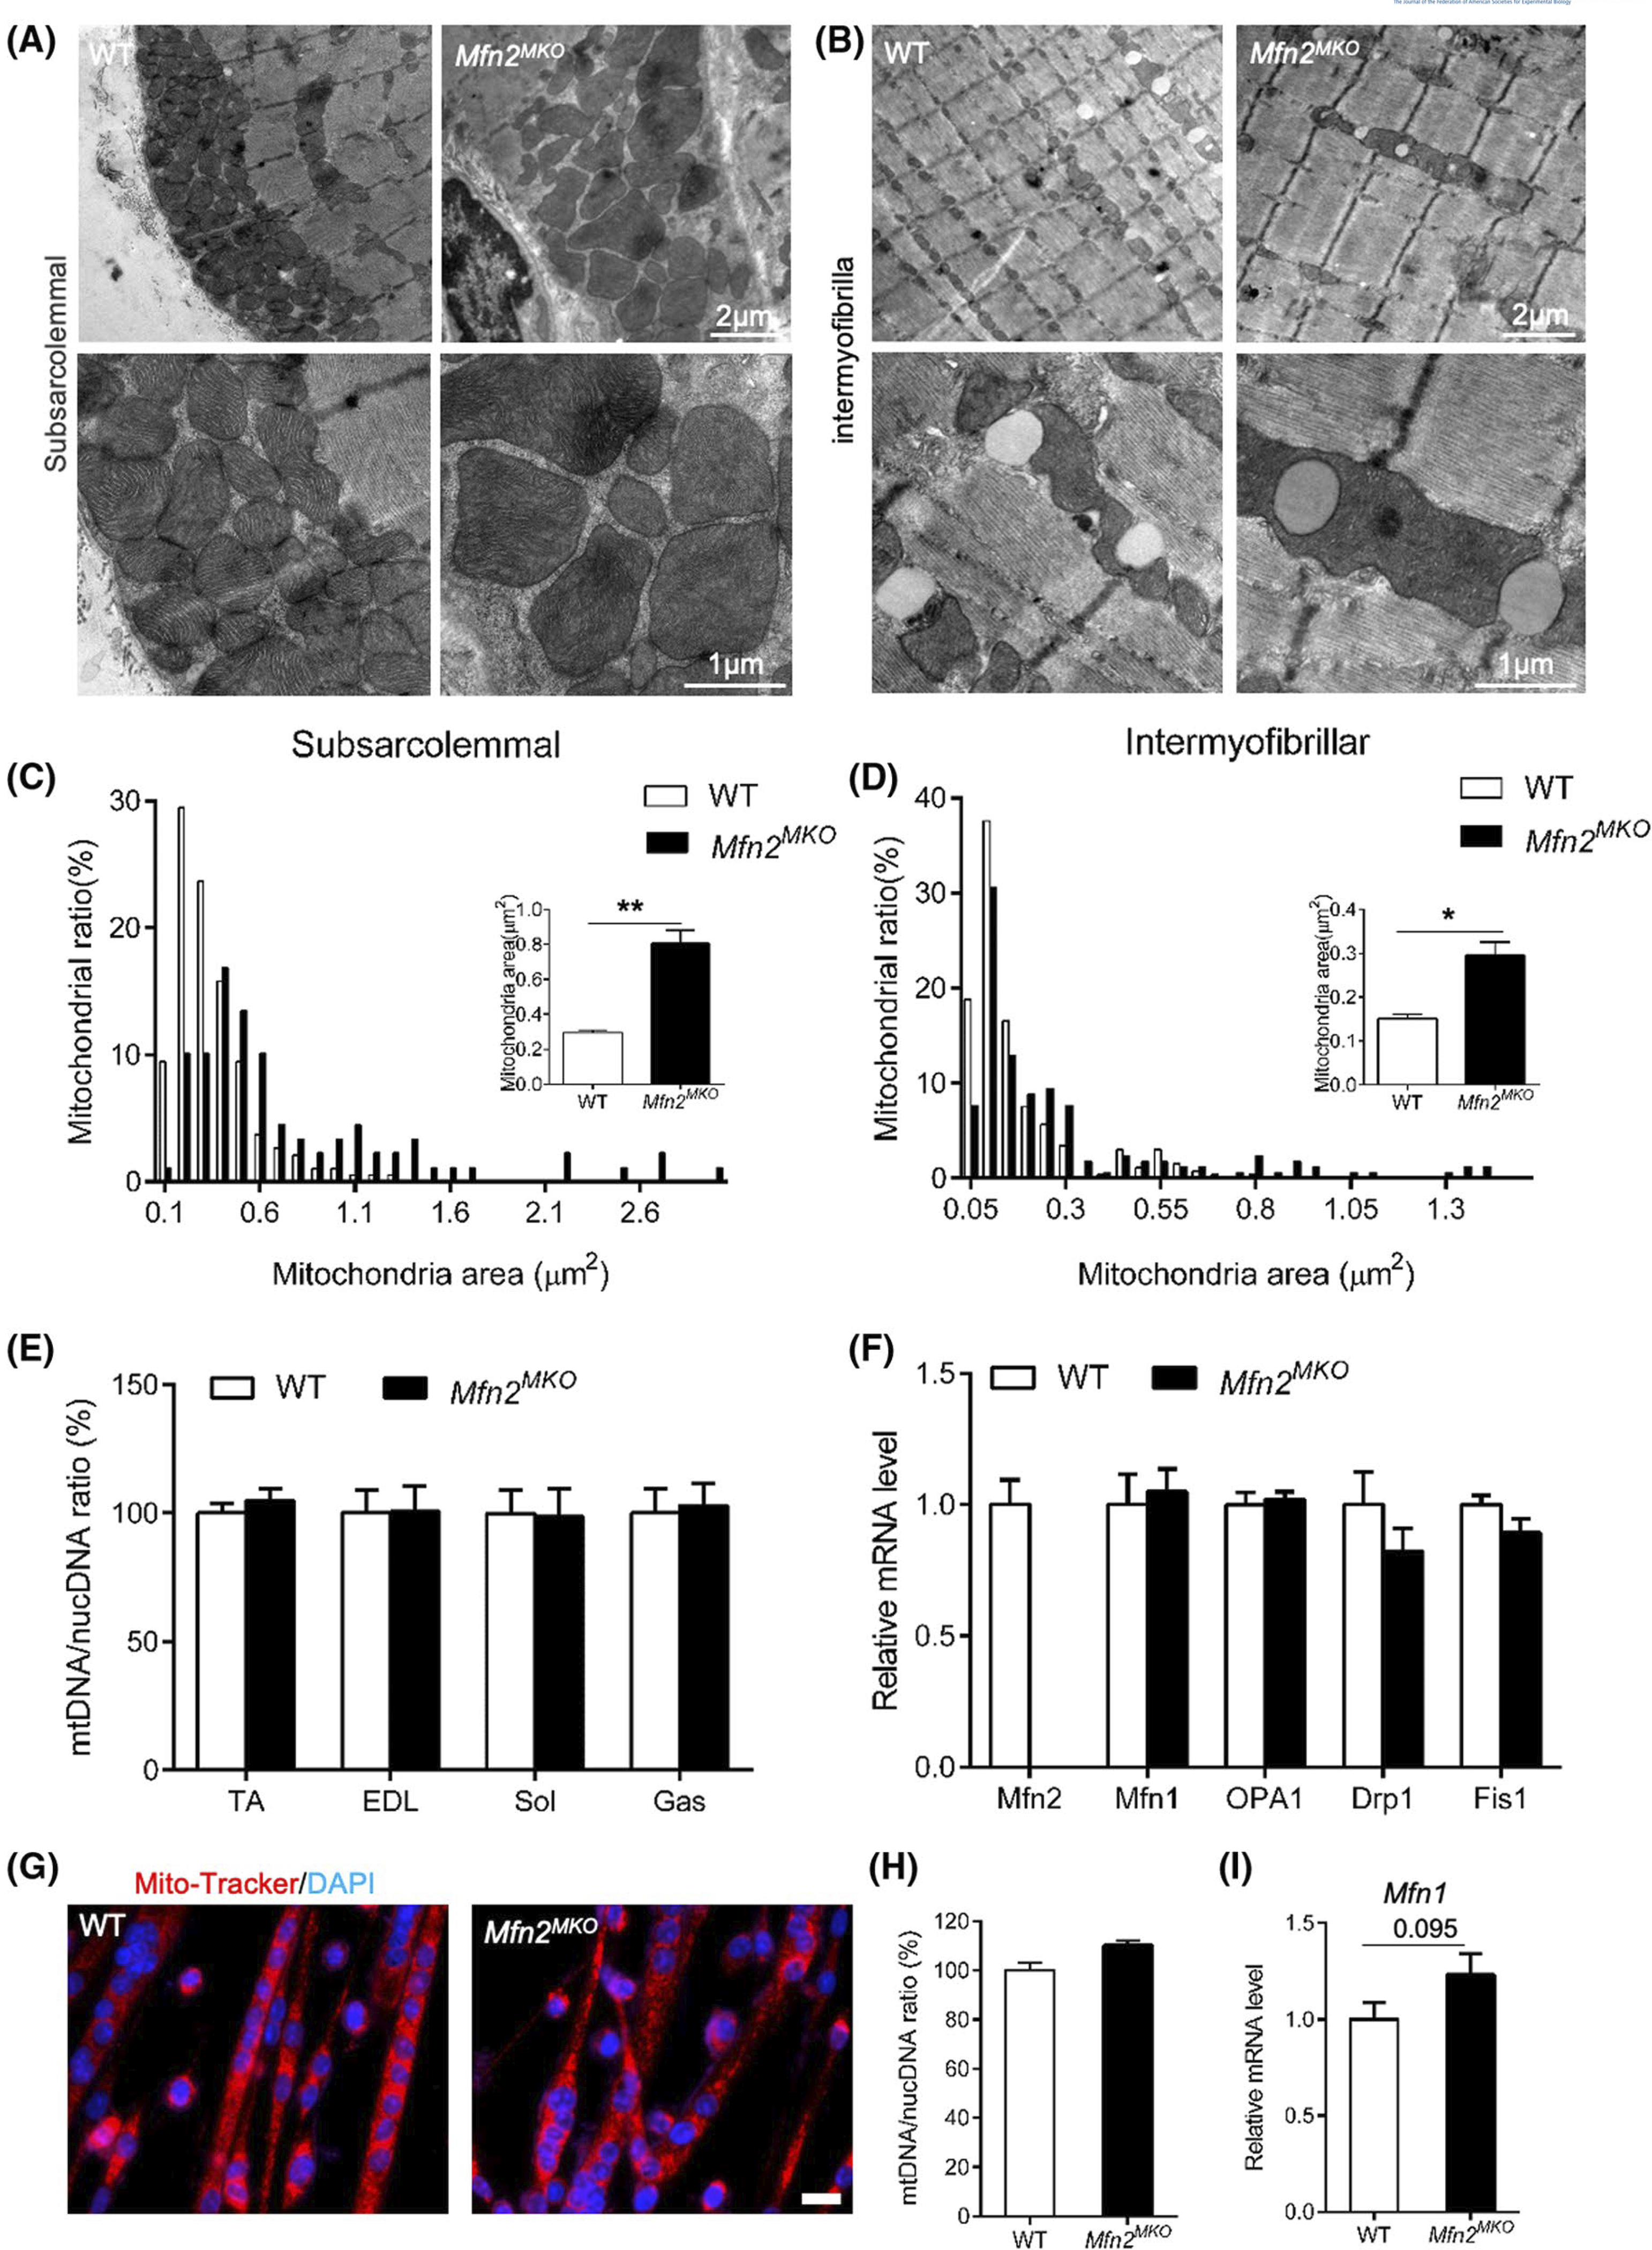
Mfn2-null myoblasts give rise to myofibers containing enlarged mitochondria. A and B, Representative transmission electron micrograph (TEM) of subsarcolemmal (A) and intermyofibrillar (B) mitochondria in WT and Mfn2MKO soleus muscles. C and D, Distribution analysis of subsarcolemmal (C) and intermyofibrillar (D) mitochondrial area in WT and Mfn2MKO muscles. Insets show the average mitochondrial areas (n = 3 pairs of mice). E, qRT-PCR analysis showing ratios of mitochondria DNA to nucleotide DNA in TA, EDL, Sol, and Gas muscles between WT and Mfn2MKO mice (n = 4 pairs of mice). F, qRT-PCR showing relative mRNA levels of fusion and fission genes in WT and Mfn2MKO Sol muscles (n = 4 pairs of mice). G, Immunofluorescence of mito-tracker in myotubes differentiated for 3 days. Scale bar: 20 μm. H and I, qRT-PCR analysis showing ratios of mitochondria DNA to nucleotide DNA (H) and mRNA levels of Mfn1 (I) in myotubes as shown in G (n = 4 pairs of mice). All data are shown as mean ± SEM (t test: *P < .05, **P < .01)