
FIGURE 8.
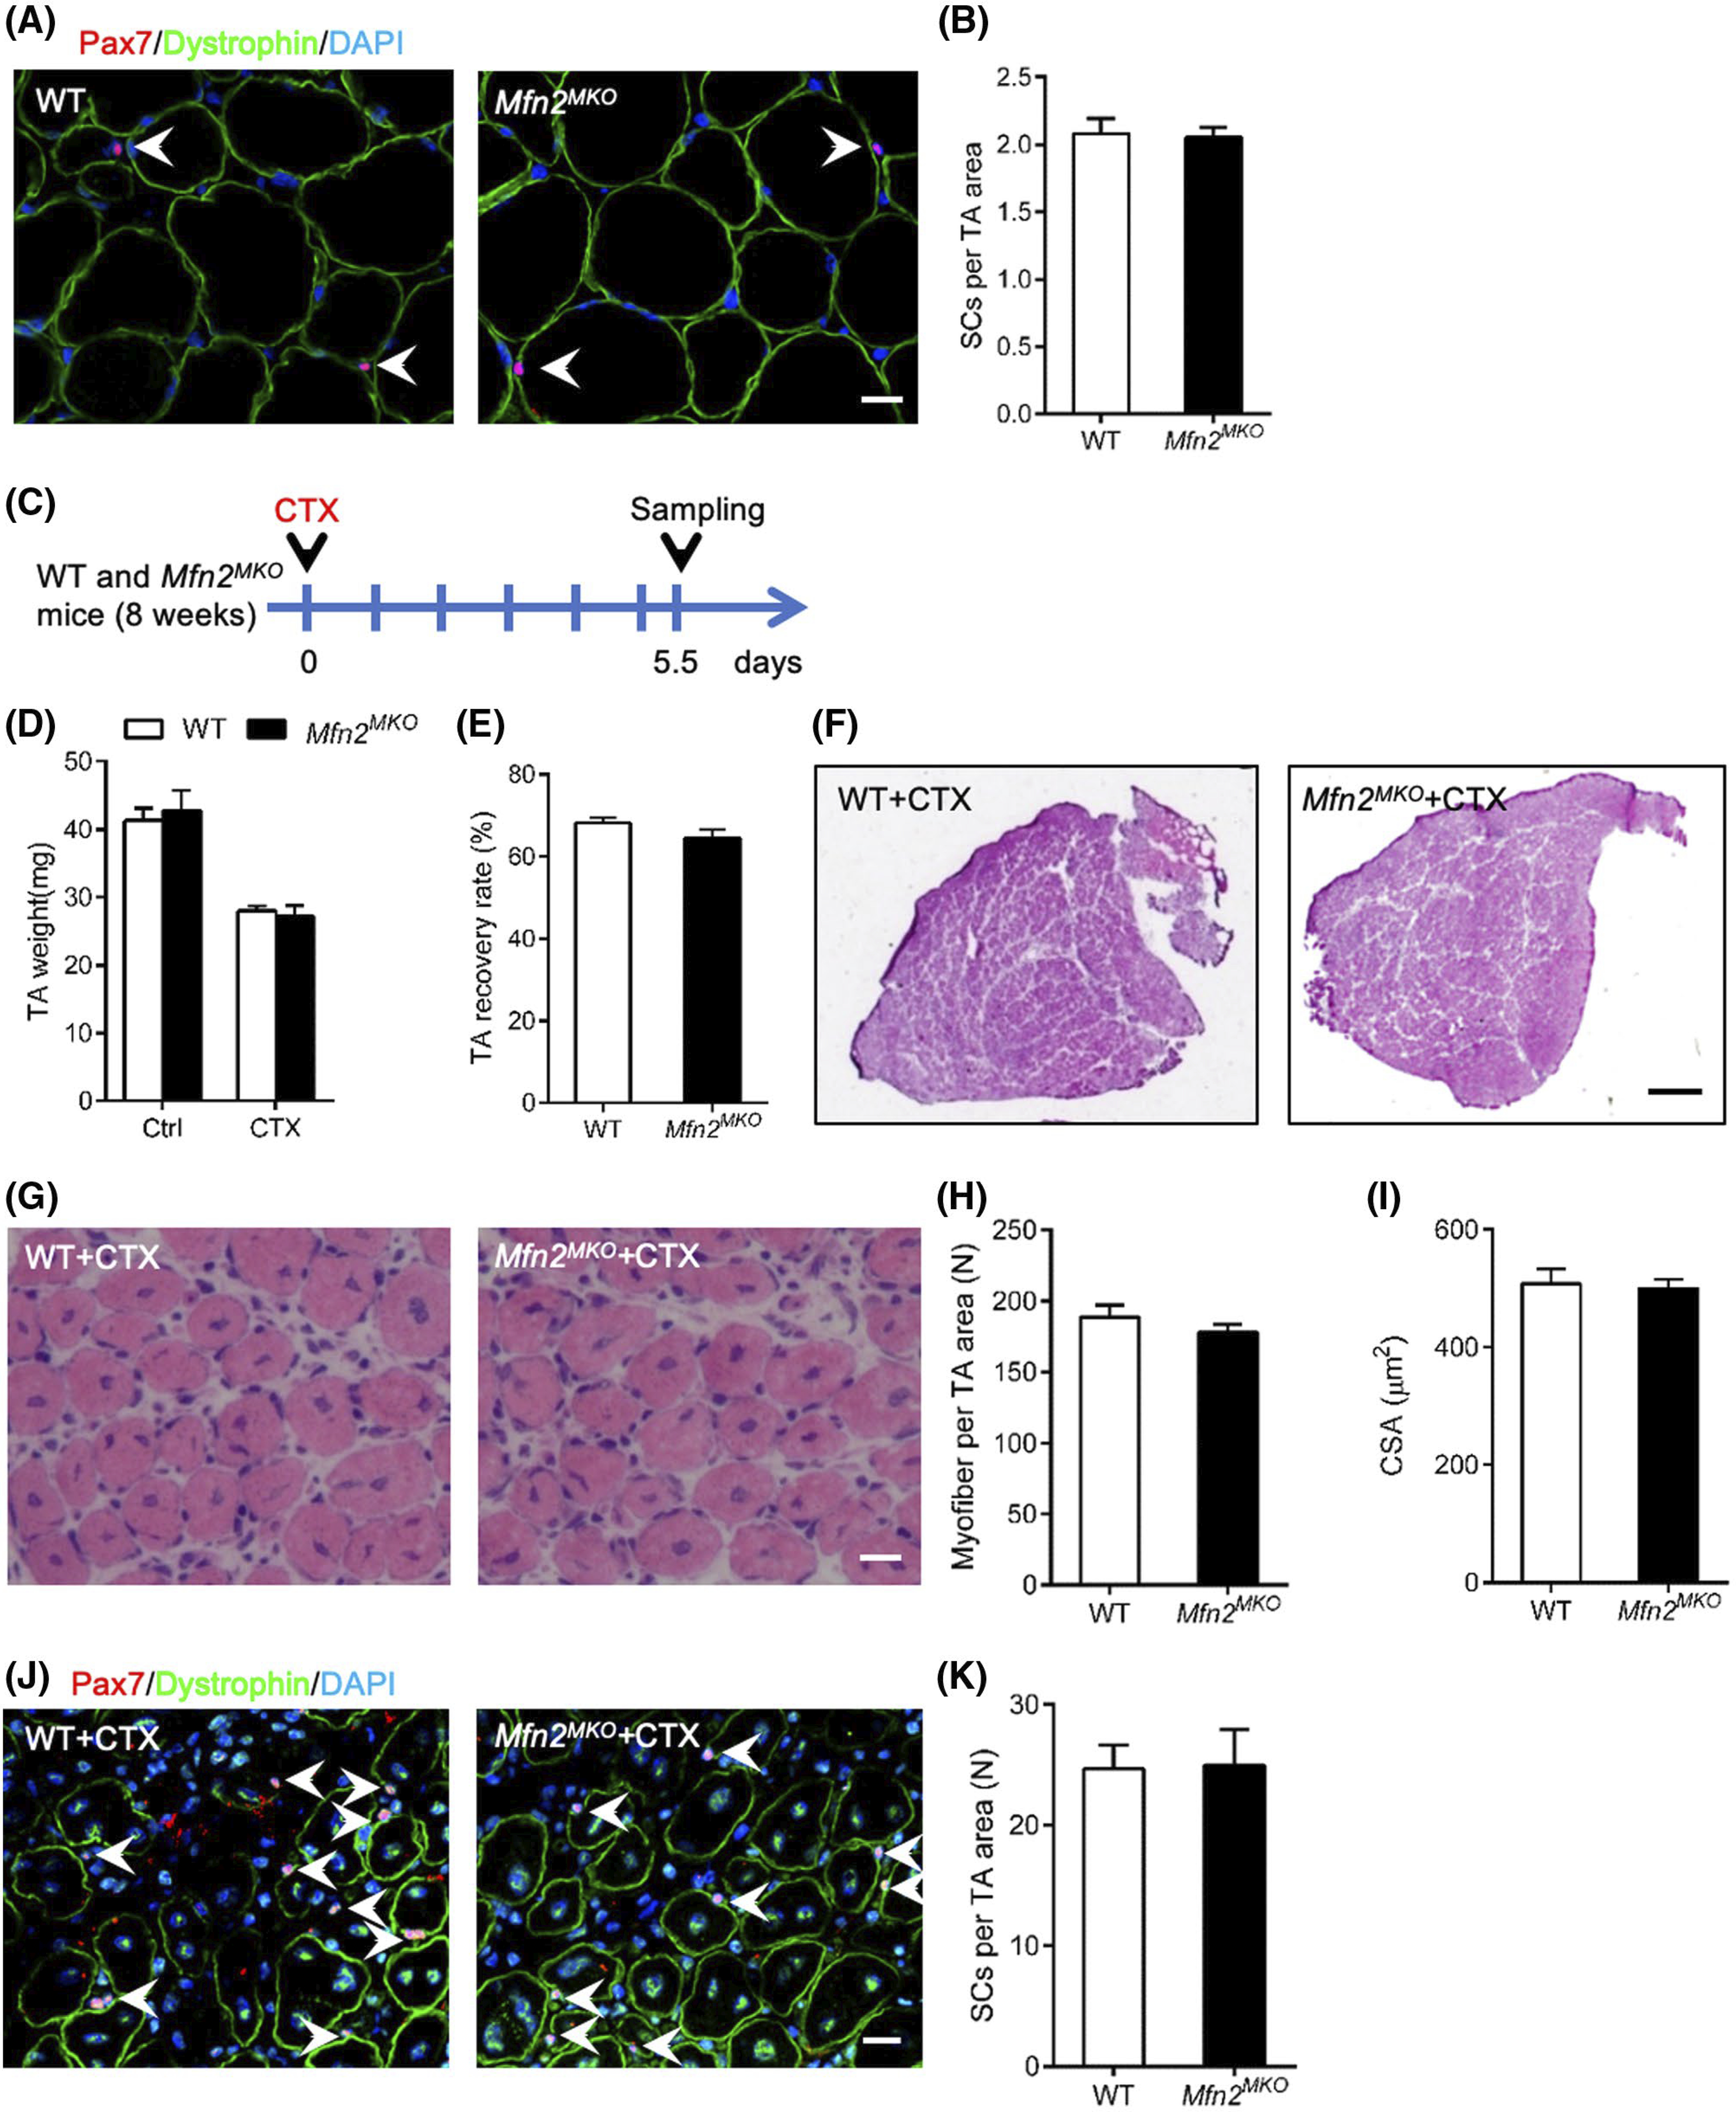
Mfn2MKO mice have normal regenerative capacity upon muscle injury. A, Immunofluorescence of Pax7 and dystrophin in TA muscle cross-sections at 8-week age. White arrows point to Pax7+ satellite cells (SCs). Scale bar: 20 μm. B, Average number of MuSCs per microscopic area (n = 6 pairs of mice). C, Experimental design for CTX injection and sample collecting. D and E, TA weight (D) and recovery rate (E, ratio of injured to uninjured muscle weights) (n = 6 pairs of mice). F and G, H&E staining of TA muscle cross-sections showing whole muscle view (F) and area view (G) of regenerated muscle at 5.5 days after CTX injury. Scale bar: 500 μm (F), 20 μm (G). H and I, Average numbers of regenerated myofibers per microscopic area (H) and cross-sectional area (CSA) of regenerated myofibers (I) (n = 6 pairs of mice, four to five microscopic areas per mouse). J, Immunofluorescence of Pax7 and Dystrophin on TA muscle cross-sections of WT and Mfn2MKO mice at 5.5 days after CTX injection. Scale bar: 20 μm. K, Quantification of the number of Pax7+ SCs (n = 5 pairs of mice, five microscope areas per mouse). All data represented mean ± SEM