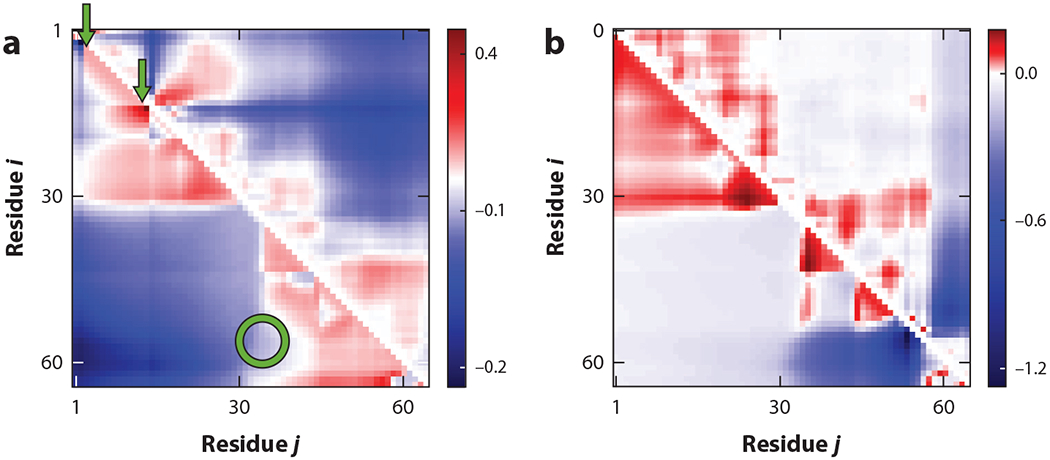
Figure 6.

Intrinsically disordered proteins and regions have hot spots for phosphorylation. Distance profiles, given by sequence-specific xi,j (relating to ⟨⟩) for amino acid pairs i, j, for two different phosphorylated forms, (a) S2T15 and (b) S54S56, of the wild-type protein P0A8H9 show that specific phosphorylation sites induce drastic conformational changes at all scales. Positive (red) and negative (blue) differences are evident in these heat maps. Theoretical results (lower triangles) exhibit trends similar to the all-atom simulation results (upper triangles). The arrows point to sequence sites of phosphorylation that can generate changes in distances among sites that are remote in the sequence (circle). Figure adapted from Reference 46 with permission from AIP Publishing.
