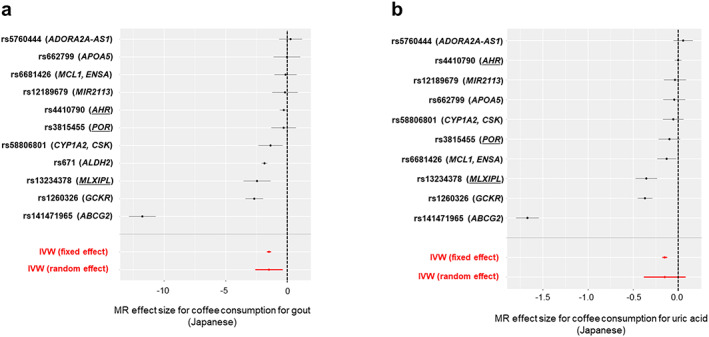
Figure 1.

Forest plots describing MR effect size for individual SNPs in the Japanese population. Effect size estimates for coffee consumption on (a) gout or (b) uric acid levels are plotted with 95% confidence intervals for individual SNPs (black) and inverse variance‐weighted analysis (red). The vertical dotted line indicates an effect size estimate of 0. The individual SNPs and the mapped genes are labeled on the left. Coffee‐associated genes common to Europeans and Japanese are underlined. IVW, inverse variance weighted; MR, Mendelian randomization; SNP, single nucleotide polymorphism.
