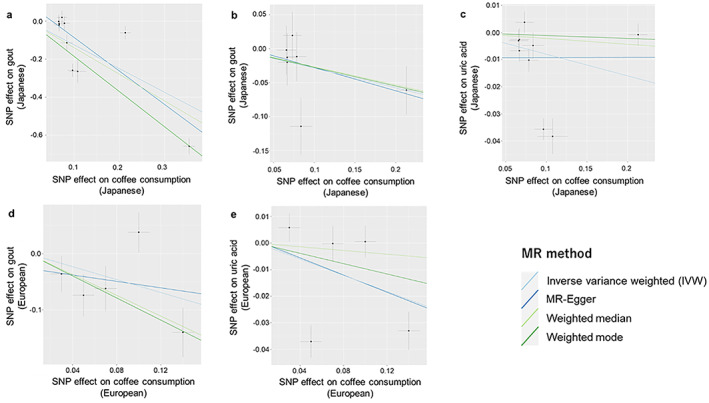
Figure 2.

Scatter plots describing the association between coffee consumption (exposure) and gout or SUA levels (outcome). Dots represent the coffee‐associated SNPs plotted along with effect size estimates on coffee consumption (x‐axis) and gout or uric acid levels (y‐axis) with 95% confidence intervals (a‐c) in Japanese and (d and e) in Europeans. The line slopes indicate the effect size estimates in four MR analyses using multiple SNPs (ie, inverse variance weighted, MR‐Egger, weighted‐median, and weighted‐mode). Each method is indicated by differently colored lines. Prior to each of the analyses, we removed the outlier instrument (rs141471965 of ABCG2) in panels a and c and removed the three instruments suspected to have pleiotropic effects on gout in panel b. MR, Mendelian randomization; SNP, single nucleotide polymorphism; SUA, serum uric acid.
