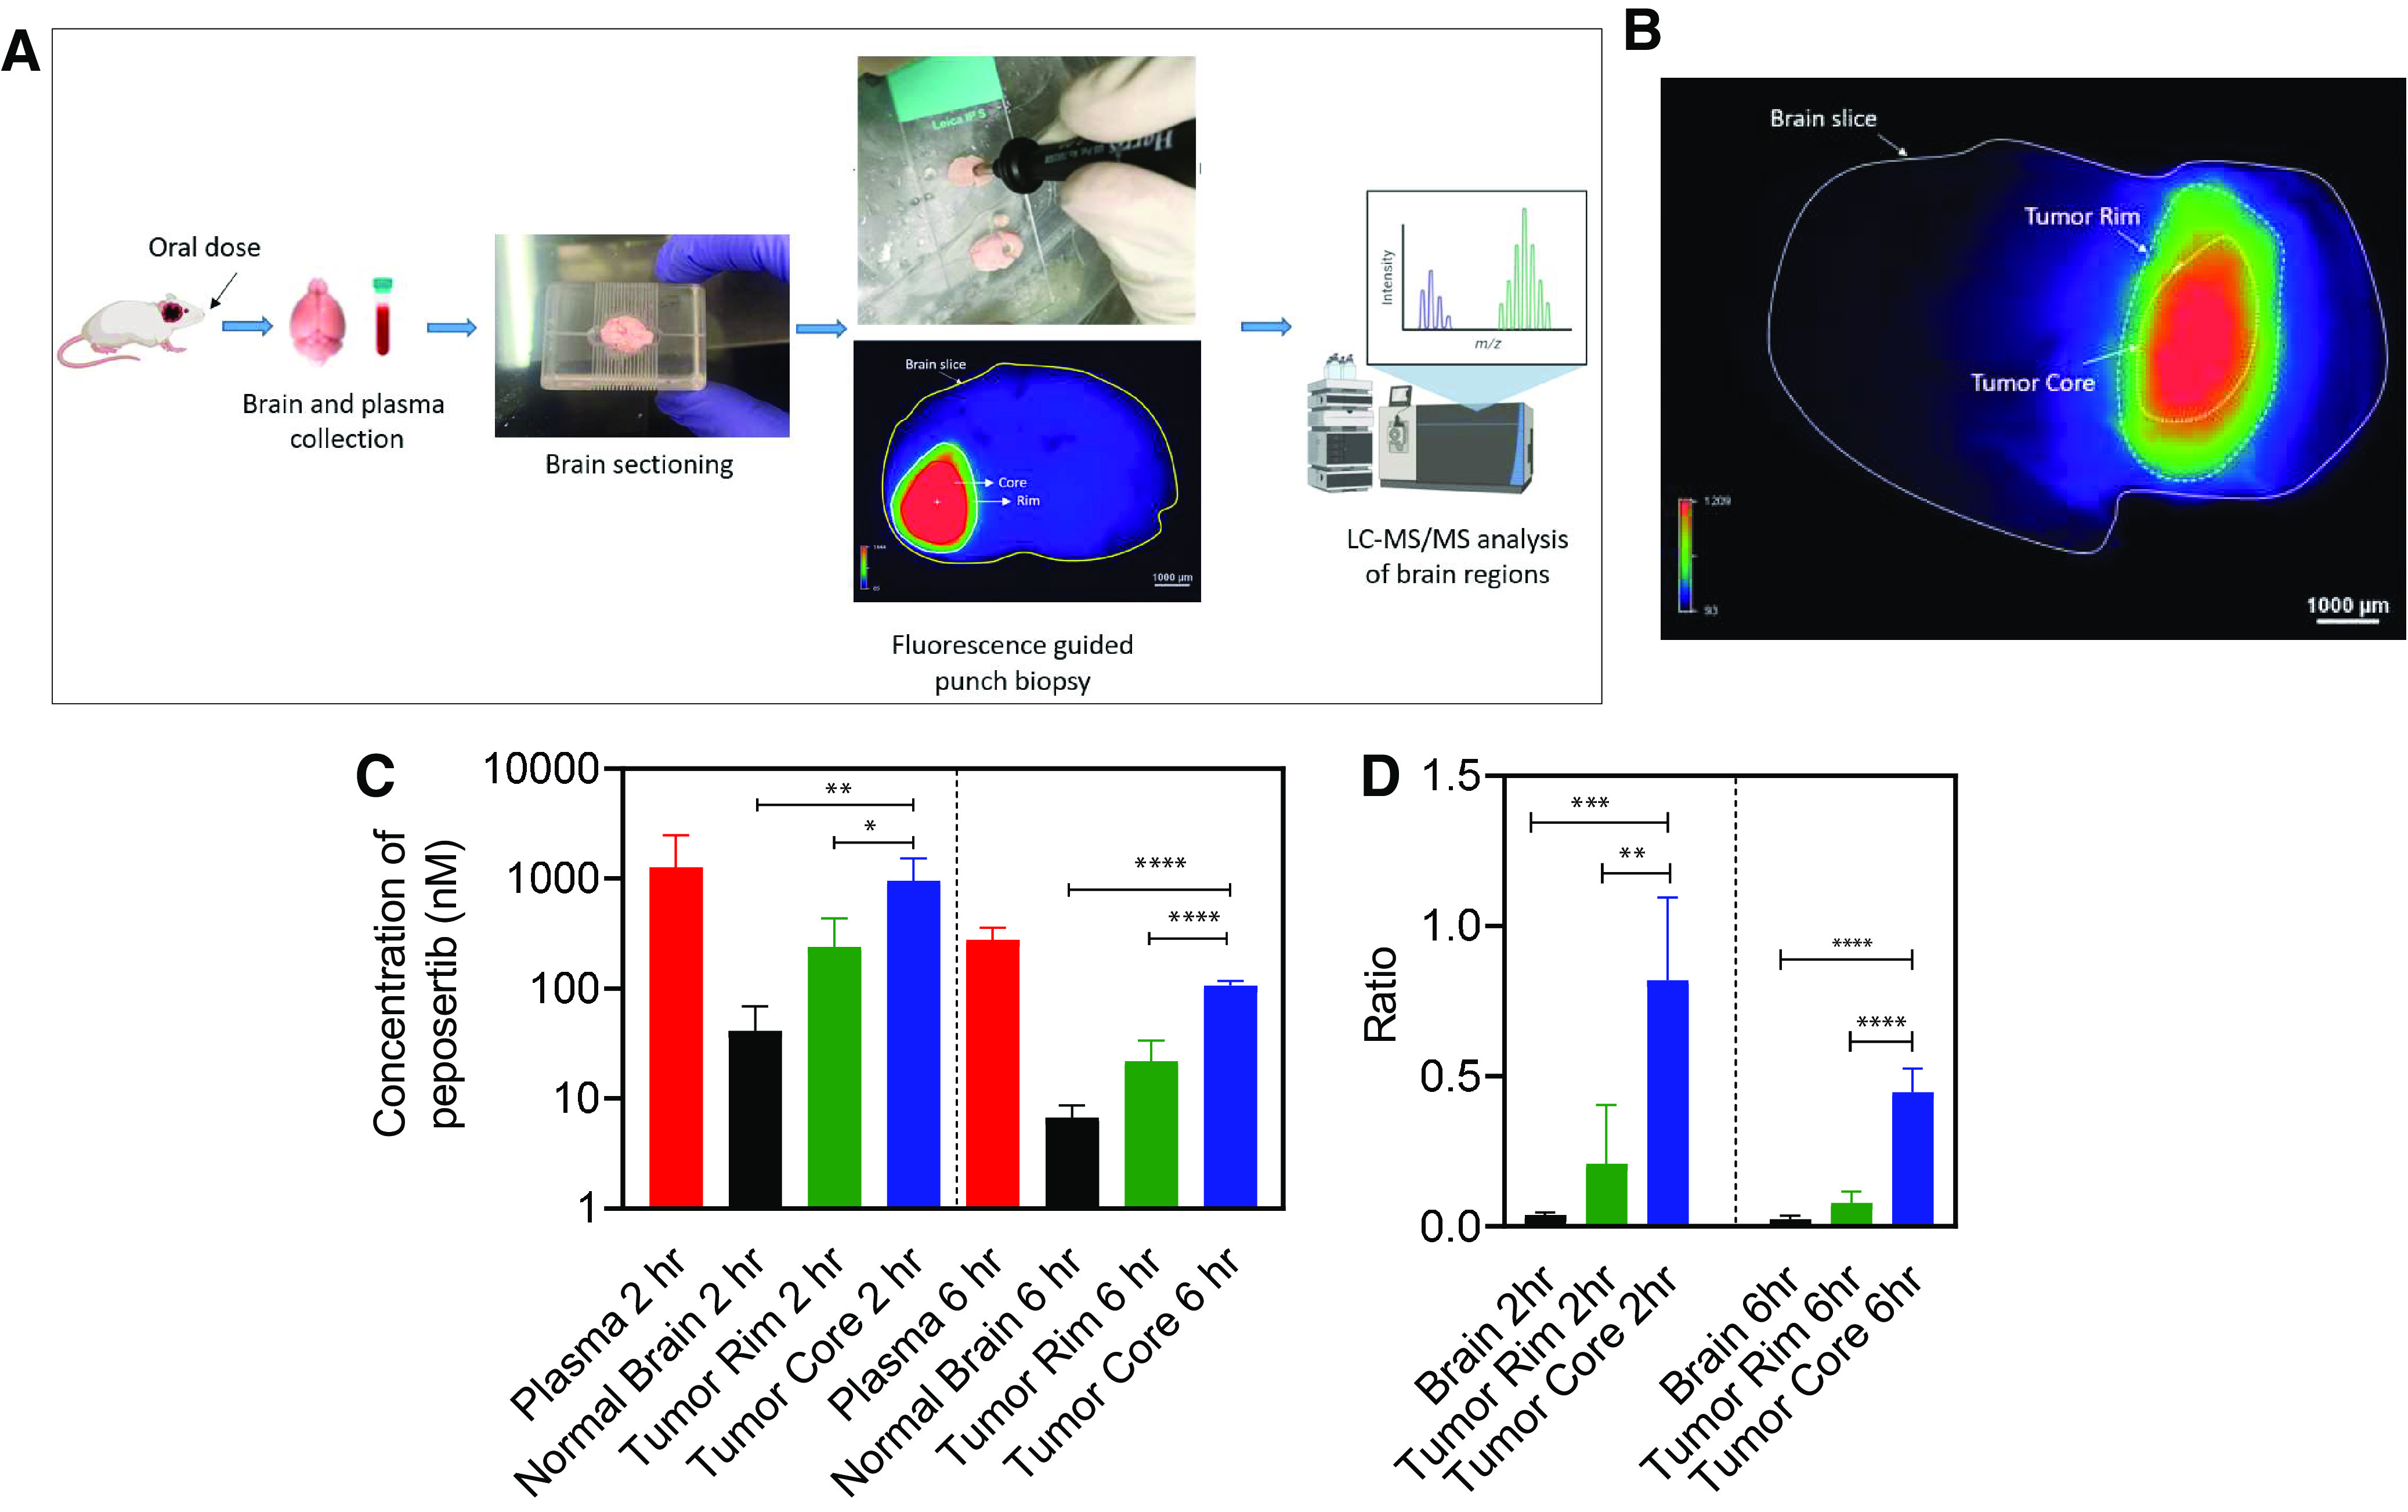
Fig. 6.

Spatial distribution of peposertib in different regions around the brain tumor following oral administration in mice with intracranial M12 tumors. (A) Schematic of the brain-slice method to study intracranial tumor spatial distribution of peposertib. (B) Representative image of mouse brain slice marked with tumor core and tumor rim regions. (C) Concentrations in plasma, normal brain, tumor rim, and tumor core, and (D) region-to-plasma concentration ratios in brain, tumor rim, and tumor core at 2 and 6 hours following a single oral dose of 50 mg/kg peposertib. Data represent mean ± S.D., n = 5. * P < 0.05, ** P < 0.01, *** P < 0.001, **** P < 0.0001.
