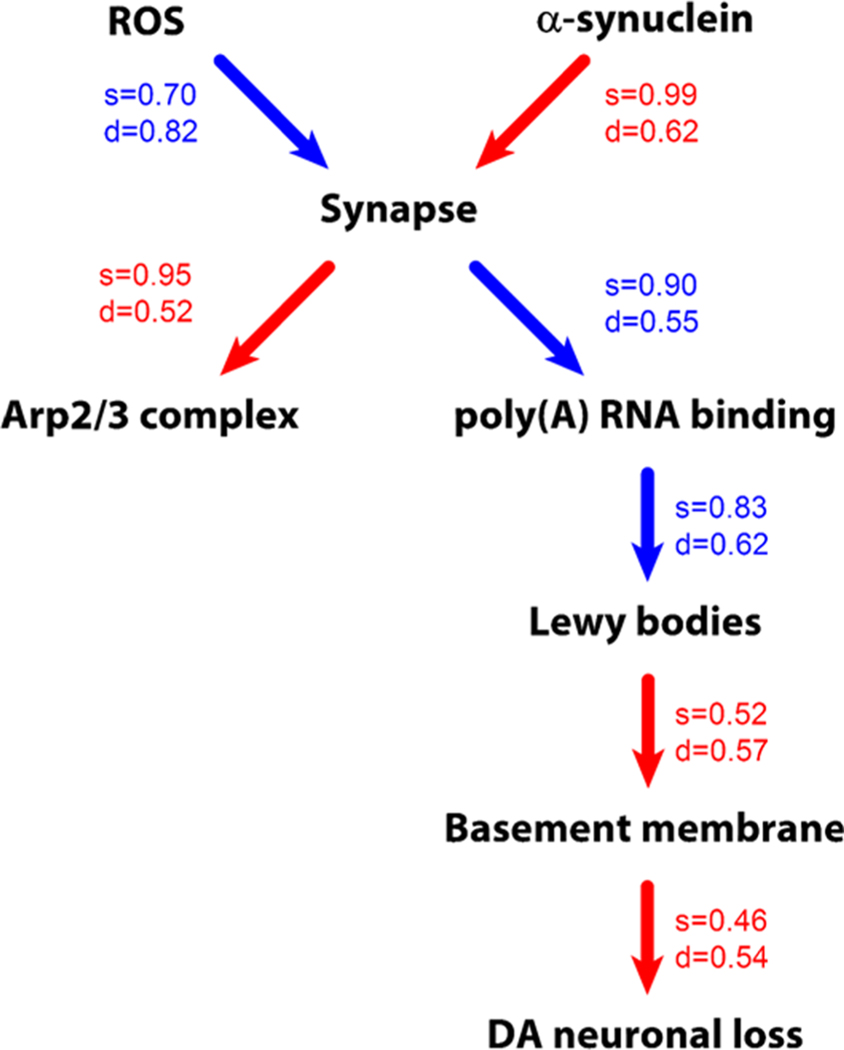
Figure 10.
Drivers of LB formation and DA neuronal loss. The representation of the causal model and associated uncertainties inferred by bootstrap analysis. Edge color represents the sign of correlation (red—positive, blue—negative). Uncertainties in the causal graph inference are shown as the probability of the edge strength (s value) and its directionality (d value).

