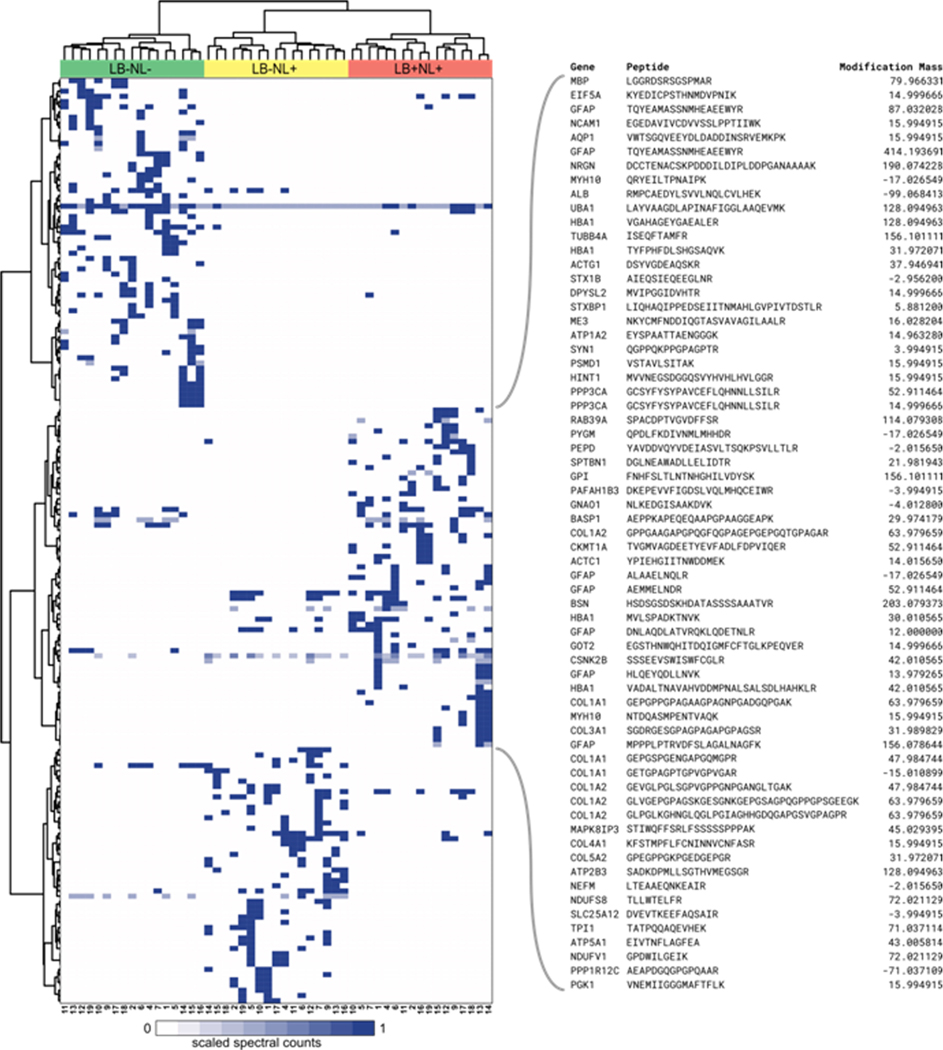
Figure 5.
Heatmap of spectral counts of the statistically significantly differentially abundant modified peptides. Spectral counts for each peptide are scaled by the highest value across the 51 samples. Cluster analysis partitioned the peptides into cluster characteristic for three groups of subjects. The majority of the peptides are exclusive to each of the three study design groups. The characteristics of the peptides for the LB+NL+ cluster are shown in the expansion on the right.

