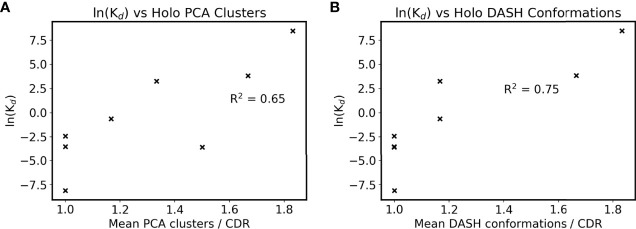
Figure 4.
Antigen bound CDR sampling and affinity. The mean number of (A) holo PCA clusters and (B) holo DASH conformations across all six CDRs is plotted for each antibody. Note that two points overlap in subfigure B at ln(Kd) = -3.5. ln(Kd) is used as a proxy for affinity due to the Gibbs free energy equation of ΔG° = -RTln(Keq), and natural logarithms of Kd values in nM are used (see Table 1 ).

