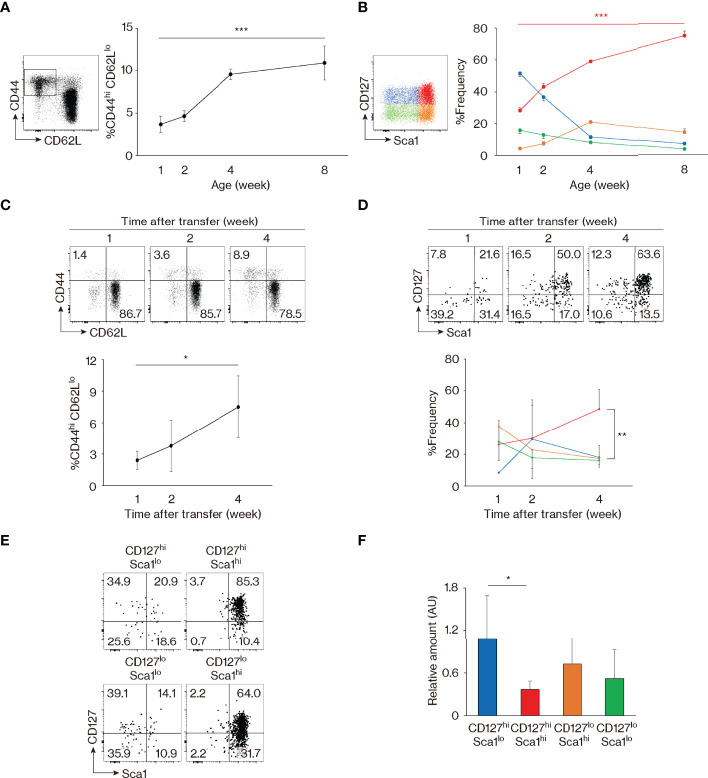
Figure 3.
Memory-phenotype (MP) T lymphocytes are composed of four subsets representing different stages of maturation. (A, B) CD127hi Sca1hi MP cells develop with age. The graphs indicate the fractions (mean ± SD) of (A) CD44hi CD62Llo among CD4+ T cells and (B) each subpopulation among MP cells (n = 3–5 mice). Representative dot plots displaying expression of (A) CD44 and CD62L in CD4+ T lymphocytes and (B) CD127 and Sca1 in MP CD4+ T cells are also included. Data shown are pooled from 2 independent experiments performed. (C, D) CD127hi Sca1hi MP cells are generated from naïve precursors. Naïve CD4+ T lymphocytes sorted from CD45.2 mice were transferred to CD45.1 wild-type (WT) recipients and analyzed several weeks later. Dot plots show (C) CD44 and CD62L expression in the donor cell population and (D) CD127 and Sca1 levels in the newly generated MP donor cells, while the graphs indicate the frequency (mean ± SD) of (C) MP cells in the donor cell population and (D) the indicated subpopulations among MP donor cells (n = 3–4 mice). Data are representative of 2 independent experiments. (E) All four MP subsets eventually differentiate into CD127hi Sca1hi cells. Four MP subpopulations sorted from CD45.2 mice were transferred to CD45.1 WT recipients and analyzed for their CD127 and Sca1 expression 2 weeks later. Dot plots in the indicated donor MP subpopulations are shown. Data are representative of 4–5 recipient mice from 3 independent experiments performed. (F) CD127hi Sca1hi MP T lymphocytes have the lowest amount of TRECs. A bar graph indicating the amount (mean ± SD) of TRECs relative to Gapdh that was calculated by the ΔCt method in each MP subpopulation is depicted (n = 5 mice). Data are representative of 2 independent experiments performed. Statistically significant differences are indicated as *p < 0.05, **p < 0.01, and ***p < 0.001.

