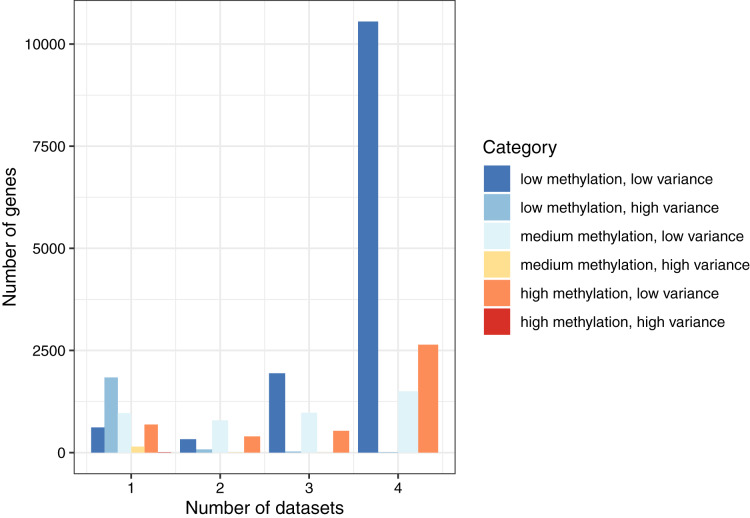
Figure 2. Consistency of DNA methylation levels and variances in normal cells.
We assigned each gene to a category that indicated whether it was methylated at low, medium, or high levels and whether it had low or high variance across samples in a given dataset. We calculated the number of genes per combination and the number of normal datasets that shared the same category.

