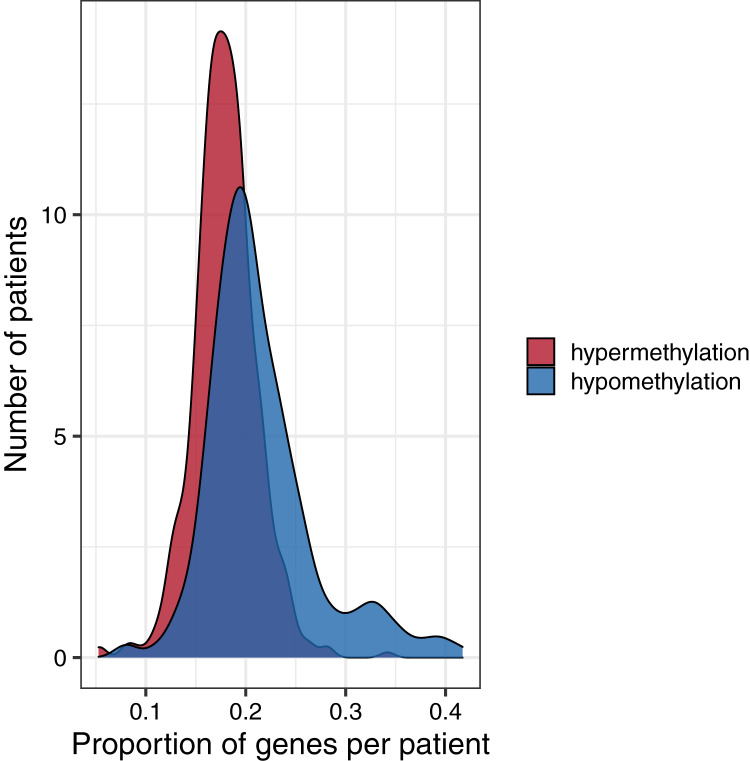
Figure 6. Distributions of the proportion of hypermethylated or hypomethylated genes in a given tumor.
Using the normal data as a reference, we identified genes that were hypermethylated or hypomethylated in a given tumor. All five tumor types are represented. A relatively large number of hypomethylated genes in a given tumor was more common than a relatively large number of hypermethylated genes.

