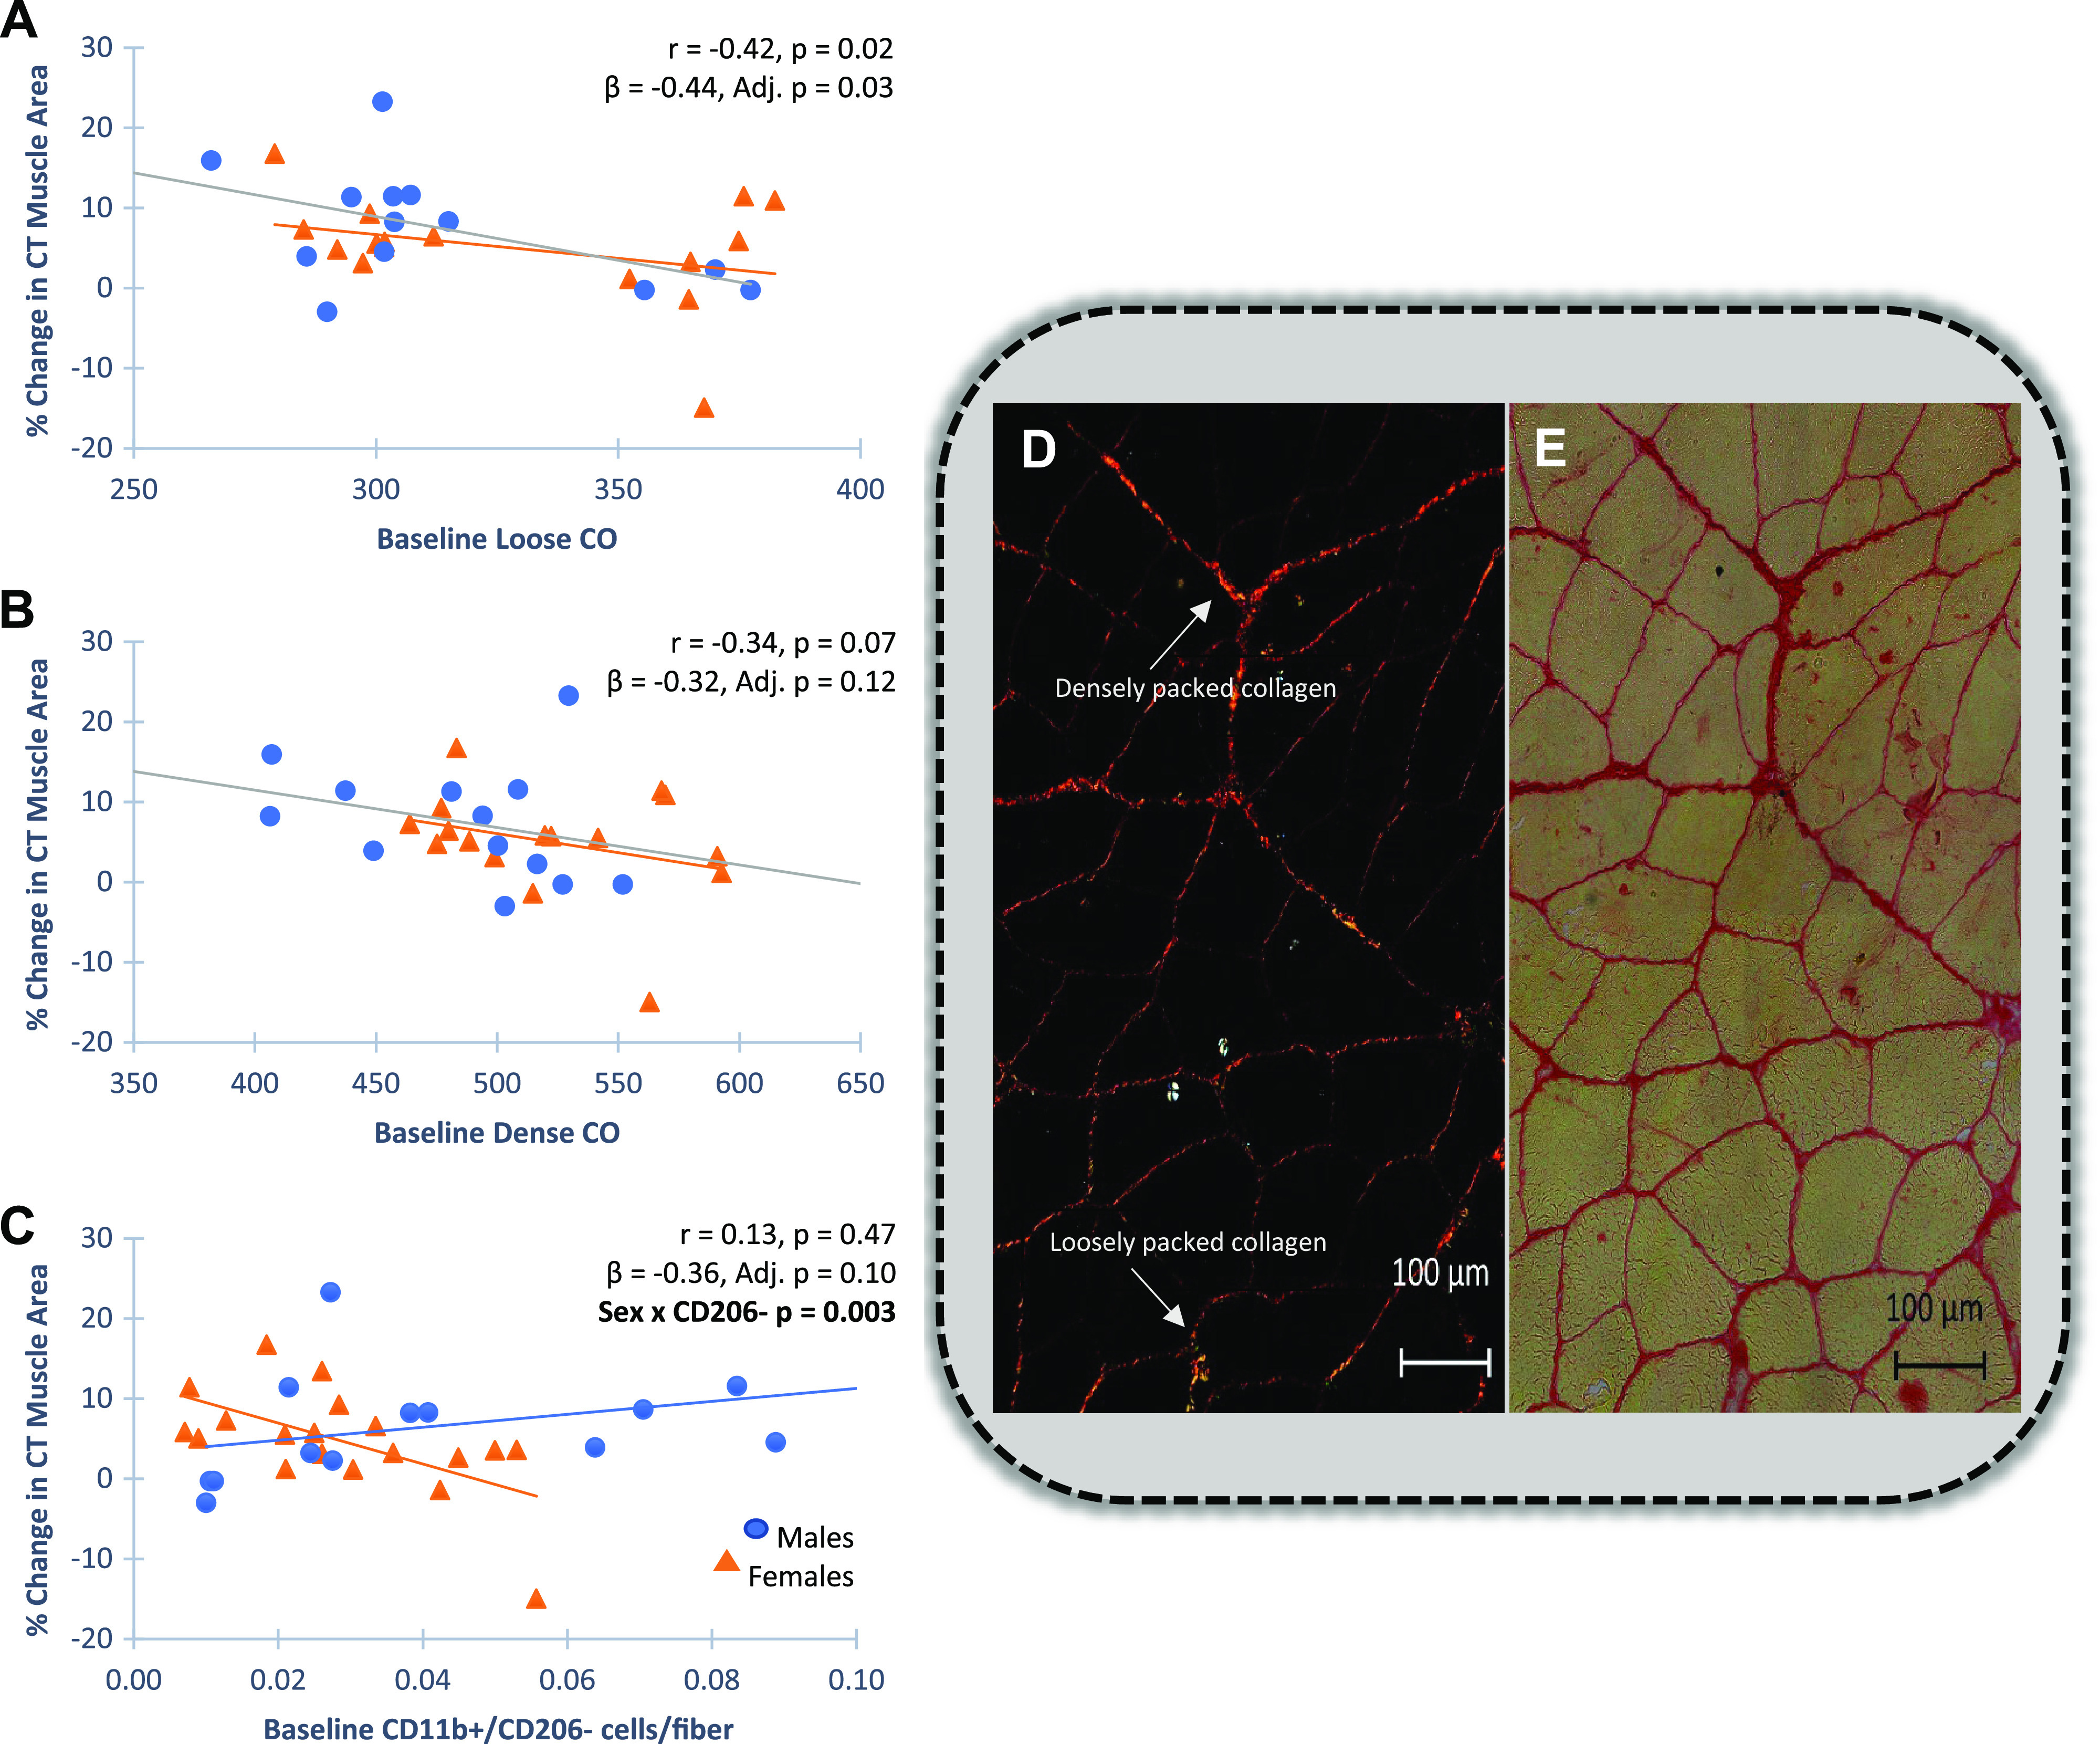
Figure 2.

Baseline muscle features associated with change in thigh muscle area quantified by computed tomography (CT). Pearson correlations for univariant comparisons and multiple linear regression adjusting for sex (standardized betas) and variable by sex to identify significant sex interactions are shown. A: quantification of polarized light imaging of Sirius Red (SR)-stained sections with baseline green fluorescence, an indicator of loosely packed collagen, negatively associated with percent change in muscle area (n = 33). B: quantification of polarized light imaging of Sirius Red-stained sections. Baseline red fluorescence, an indicator of more densely packed collagen, trended to be negatively associated with increased muscle area (n = 33). C: CD11b+/CD206− immune cell abundance trended to be negatively associated with growth in females, with a significant sex by cell interaction (n = 37). Males are designated as blue circles and females are designated as orange triangles. Confidence intervals for all standardized βs are provided in Supplemental Table S1. D and E: representative images of Sirius Red (SR) staining of fibrous collagen in a baseline muscle section are shown. D: polarized light imaging shows hue components that reflect collagen organization. The number of red (densely packed collagen) and green (loosely packed collagen) pixels were quantified using a thresholding technique and expressed per area in ImageJ. E: visible light imaging of total fibrous collagen was quantified and expressed as percentage of total area.
