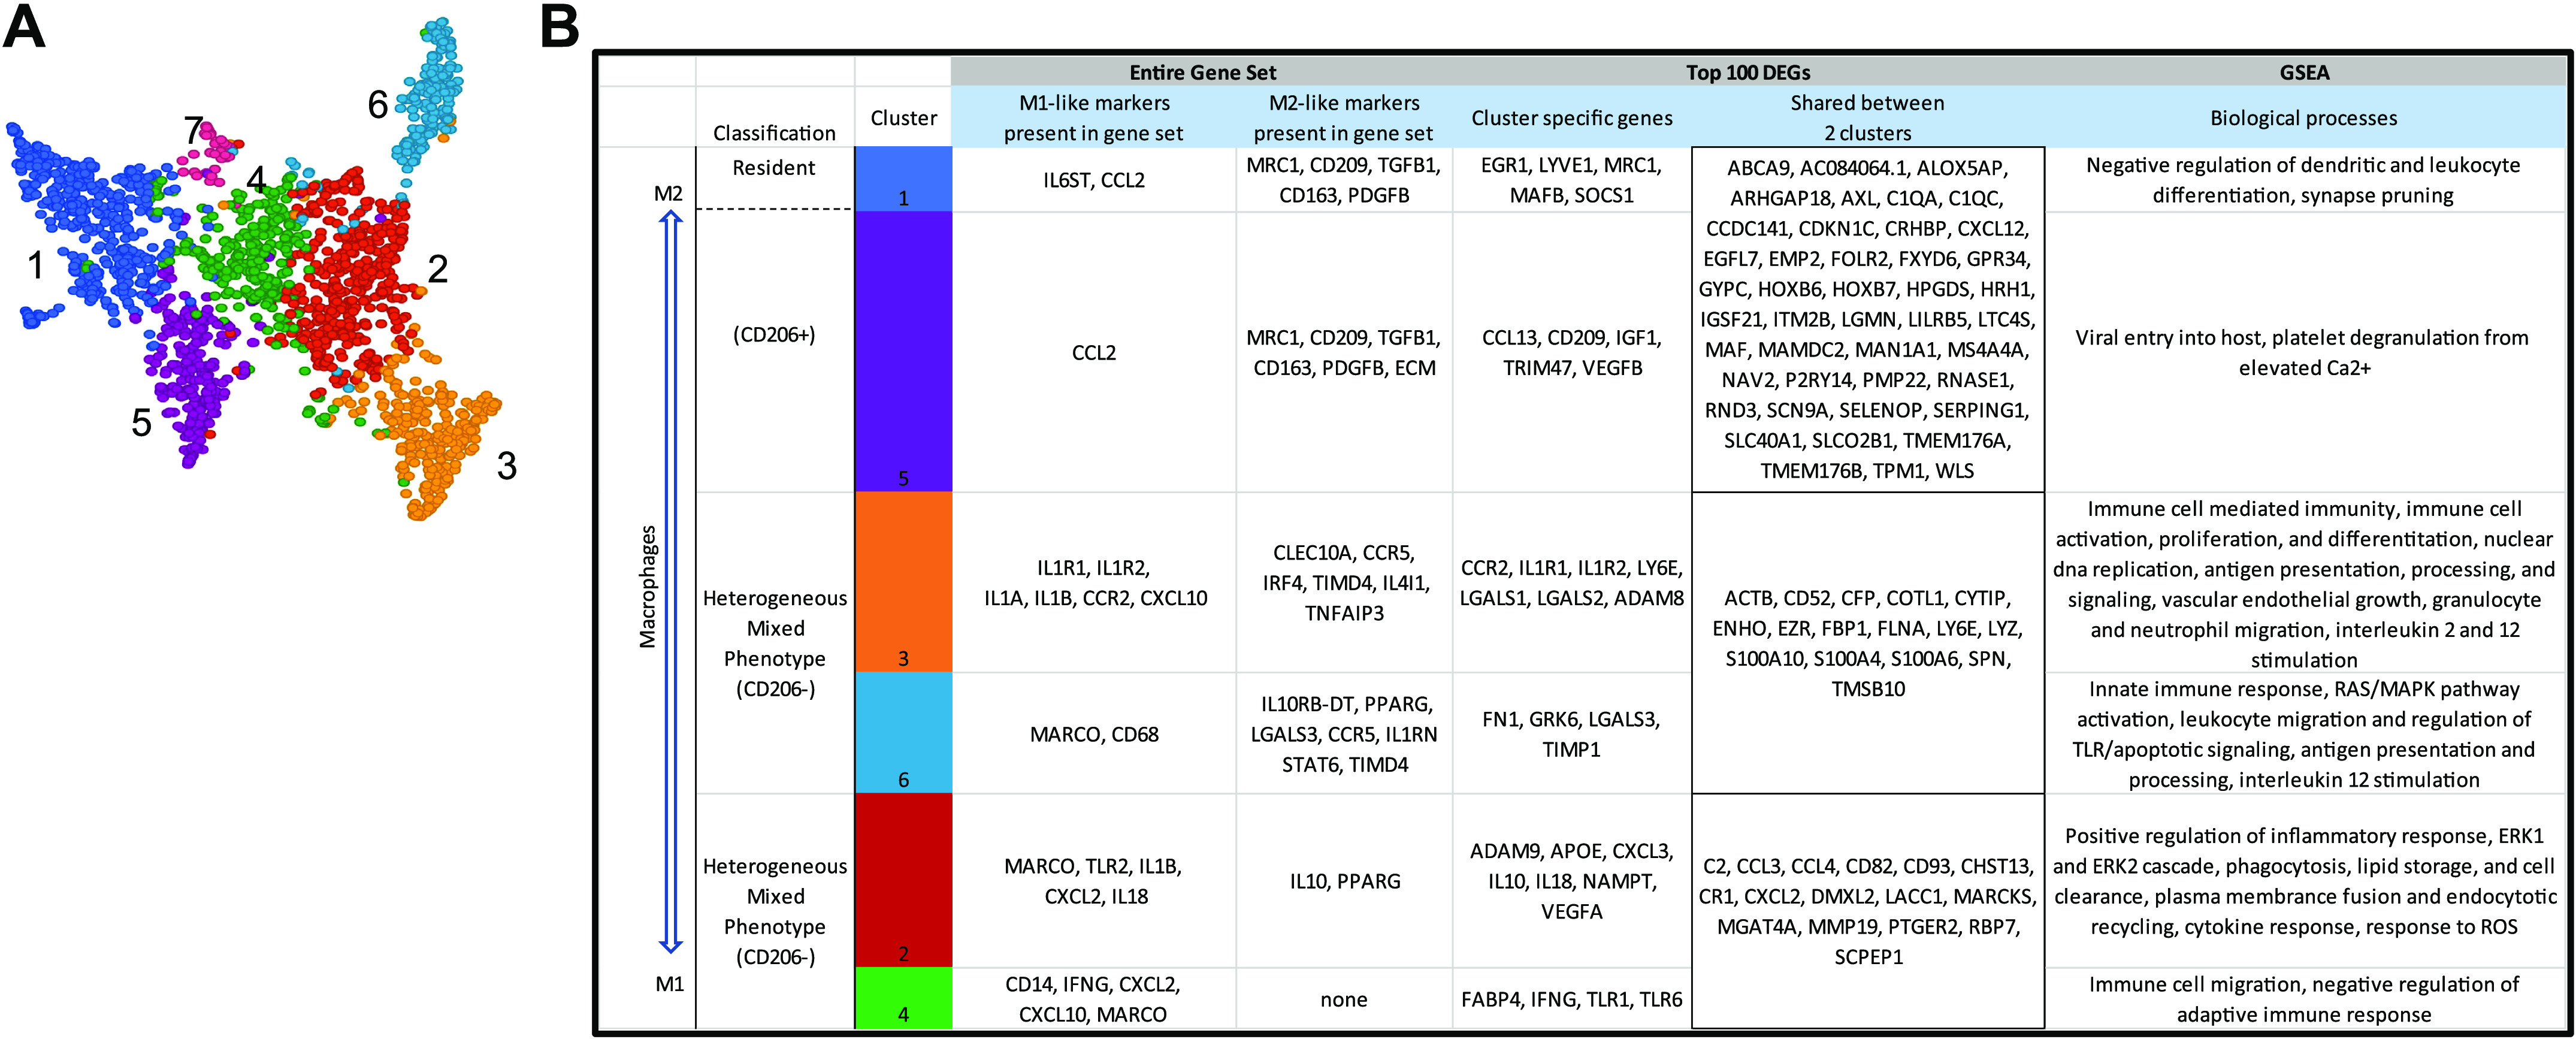
Figure 6.

Single-cell transcriptome atlas of macrophages 24-h postresistance exercise (n = 1). Single-cell RNA sequencing of CD11b+ cells and unbiased graph-based clustering showed 6 macrophage clusters (A). B: from the top 100 differentially expressed genes (DEGs) in each cluster, genes characteristic of macrophage phenotype and/or functions are shown. Supplemental Table S6 shows DEGs of the six separately identified macrophage subclusters.
