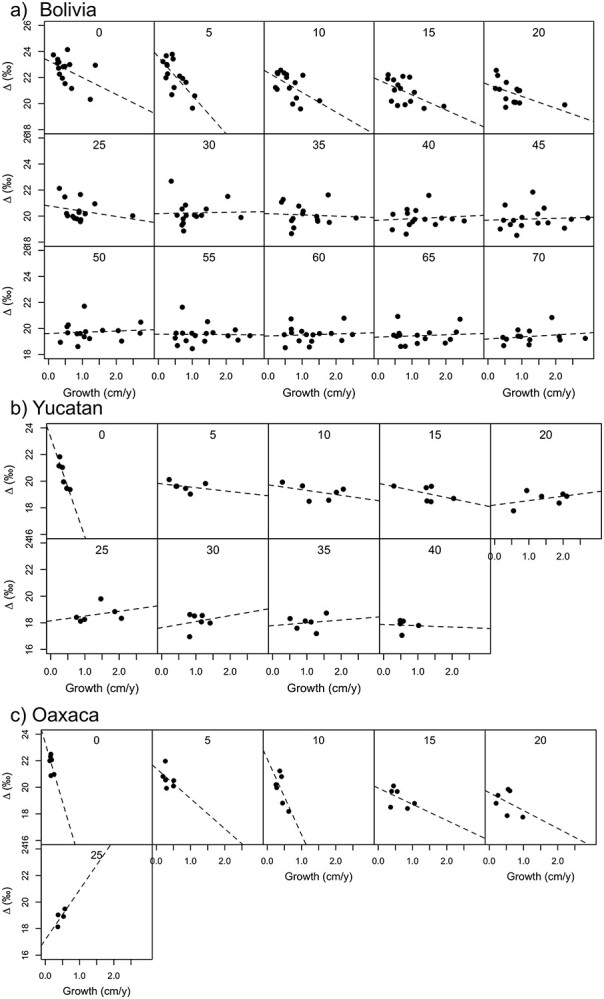
Figure 6.

Relationship between mean diameter growth and Δ13C in diameter classes of 5-cm widths for Bolivia (a), Yucatan (b) and Oaxaca (c). Each point represents the mean of diameter growth and Δ13C for a different tree. Numbers at the tops of the graphs denote the lower boundary for each size class in cm.
